Understanding Support and Resistance in the Trading Landscape
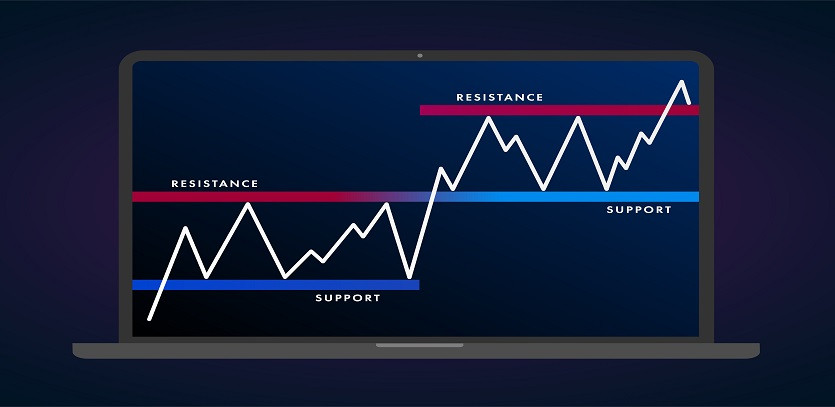
Support and resistance play a pivotal role in technical analysis, serving as significant levels on a chart where the forces of supply and demand balance out, potentially causing a trend to pause or even reverse. In essence, 'support' is a point where the market's buying power is expected to be strong enough to prevent the price from decreasing further, while 'resistance' is a threshold where the selling power is predicted to halt further price escalation.
Unearthing Support and Resistance: The Various Factors
These critical price levels can arise due to several influences, such as:
- Historical trends: Past price points, which have previously triggered a trend reversal, often resurface as support or resistance later on.
- Chart formations: Different patterns in technical analysis charts, like the 'double bottom' or 'head and shoulders', often signify impending support or resistance.
- Moving averages: These are a special type of technical tool that can be employed to highlight potential support and resistance zones.
Can Trading Based on Support and Resistance be Profitable?
Yes, trading based on support and resistance can lead to rewarding outcomes. However, like all trading strategies, it doesn't come with a profitability guarantee. The success of this method hinges on several aspects, including:
- Precision of your analysis: The better you can pinpoint the support and resistance levels, the higher the likelihood of making gainful trades.
- Risk management acumen: Using risk control measures, such as stop-loss and take-profit orders, is vital when dealing with support and resistance trades.
The Dynamics of Support and Resistance
These key price levels operate by pinpointing zones likely to witness a high concentration of buyers or sellers. A support level sees the buyers stepping in to prevent further price drop, potentially triggering a price bounce in the existing trend's direction. Conversely, upon hitting a resistance level, sellers come into play, stalling the price rise and possibly causing the price to decline within the prevailing trend.
Identifying Support and Resistance: The Tools of the Trade
Several technical indicators assist in determining these critical levels. The most commonly used ones are:
- Moving averages: This tool helps in smoothing out price fluctuations and identifying potential support and resistance zones.
- Bollinger bands: This indicator, using moving averages and standard deviation, helps ascertain support and resistance levels.
- Relative Strength Index (RSI): RSI is a momentum oscillator that identifies overbought or oversold situations, often leading to support and resistance zones.
What do the Experts Say?
Many seasoned traders incorporate support and resistance levels into their trading blueprint. However, there is no universal solution to leverage these levels. It's crucial to devise a strategy that suits your trading style and consistently hone it over time.
Crucial Considerations for Support and Resistance Trading
Certain factors must be factored in while trading with support and resistance, such as:
- Timeframe: The timeframe of your trade can change the relevance of a support or resistance level. For instance, a daily chart support might not be relevant on a weekly chart.
- Market volatility: In a highly volatile market, support and resistance levels are more susceptible to breaches.
- External influences: Events like economic announcements can sway the behavior of support and resistance levels.
Wrapping Up
Employing support and resistance for trading is a prevalent strategy, offering promising trade prospects. Nevertheless, remember that no trading technique comes with an assured profit guarantee. Implementing proper risk control measures while trading with these levels is equally imperative.


