Technical analysis of plotting. A trading tool that, when used correctly, can provide such an advantage that even the best fundamental or well-known indicator cannot match it.
And although today's indicators can really do a lot, the human perspective and thought processes are still among our unique human qualities that even the most robust AOS still can't 100% replace.
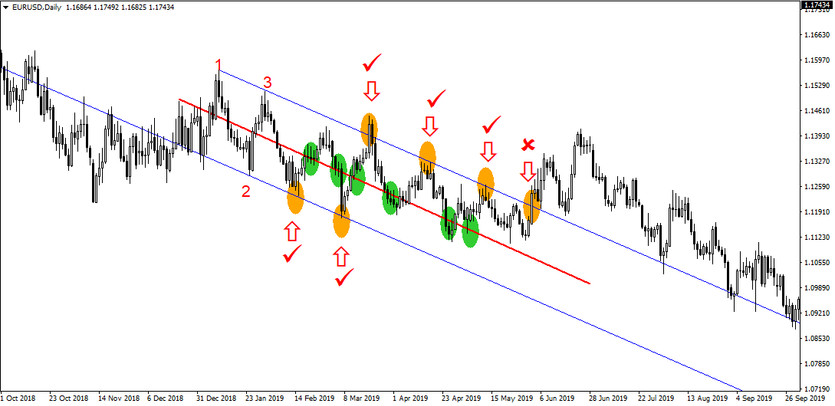
Strategy input rules (example)
Entering long positions
- Hitting the bottom line of the channel
- Passing up through the center half-channel
Entering short positions
- hitting the upper channel line
- passage through the centre half-channel downwards
How to trade with the strategy
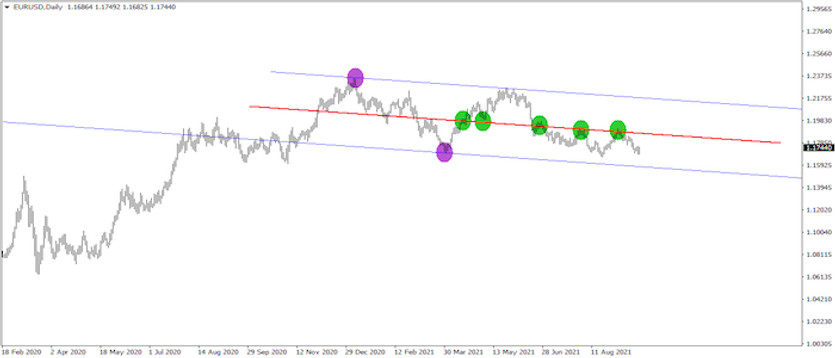
The most important part of the strategy is to correctly plot the trend channel, which is always done by drawing 3 consecutive tops/bottoms (see chart below - numerically marked). After that, you still need to create a half-channel (this is the trend line drawn in the middle of the channel - the red line). And now you just have to wait until a channel or half-channel line is hit and then enter according to the rules above.

Today's strategies offer a large number of trading opportunities, with overall success rates typically in the 55-75% range across different trading instruments.


