MACD, one of the most historically famous trading indicators, which usually expresses the relationship between several moving averages and informs the trader about the current market situation.
Thus, the MACD is mostly used as an important indicator of the current weakening/strengthening market situation, which traders then usually use to time their future trades.
Strategy entry rules
Entering long positions
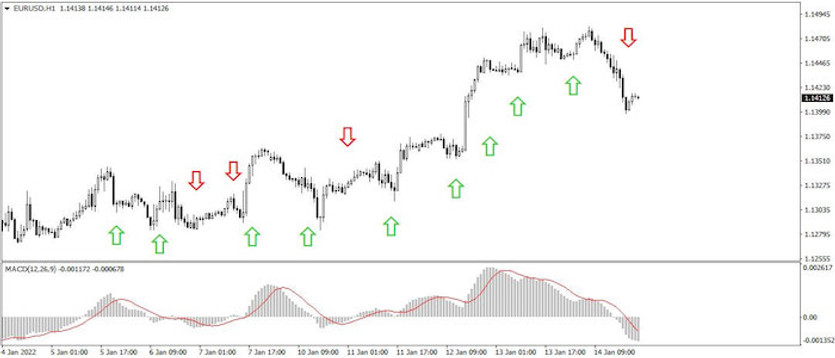
1) the indicator bars cross the zero boundary (are generated above it)
2) to increase the success rate, entries occur only with the current uptrend
Exit from positions
1) the indicator columns cross the zero threshold (they are generated below it)
2) to increase the success rate, entries with only a current downward trend occur
How to trade with the strategy
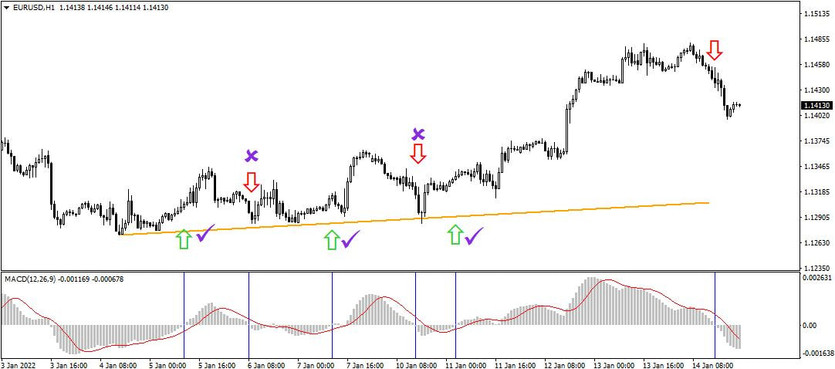
The best way to trade today's strategy based on the MACD indicator is in direct combination with the trend lines (see chart below). If the current trend situation looks like a pro-growth one and the indicator bars start to form above the zero line, then it is usually a good time to open a buy position. Conversely, if the trend lines indicate a decline and the indicator bars move from positive to negative, then it is usually better to enter short positions instead.
Tip: For an even better prediction of the current market situation, it is also possible to use, for example, one of the other indicators based on moving averages. Here, however, care must be taken to get the "right" settings, which can have a significant impact on the final result.

With the MACD indicator and today's trading strategy based on it, it is possible to achieve a success rate of around 50%. In addition, if only entries are made in line with the short-term trend, then success rates of about 10-20% higher can be achieved.


