Long-term trading strategies are usually among the least demanding in terms of psychology, but even though it may not seem so at first glance, the profitability, when compared to medium-term strategies, is often comparable, and sometimes even much higher.
Today's monthly strategy, however, has the added advantage that not only does the size of the Take-Profits exceed the size of the Stop-Losses many times over, but the strategy also achieves an unprecedented success rate, so it is no exception that 7 out of 10 trades here end in profit.
Strategy entry rules
Entering long positions
- Trading on the MN timeframe
- The indicator lines leave the bar section located below the zero level
Entry into short positions
- trading on the MN timeframe
- the indicator line leaves the bar section located above the zero level
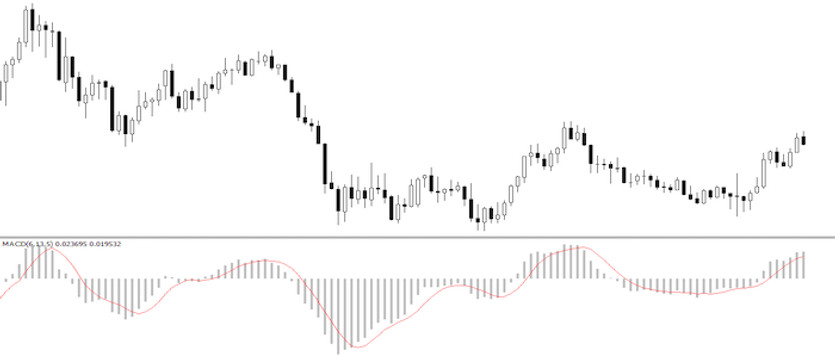
In the chart below you can see the whole process from entry to exit according to today's trading strategy and for a better understanding we will break down the whole situation here.
The entry signal is considered as leaving the bar part of the indicator. If we look at the MACD indicator, then it can be seen that this happened just when the candle marked the first vertical line (green rectangle on the MACD), but it was necessary to wait for its closure (the MACD is still changing) and then only to enter. The SL is normally placed on the High (in the case of long trades it is placed on the Low) of the candle on which the bar section was exited (see chart). Finally, the exit occurs when the opposite entry conditions are met (see chart below - black MACD rectangle).
With this unique strategy, any trader can achieve success rates that can even climb to values exceeding 85% in some instruments.


