Once again, today we have here one of the Price Action trading strategies that are characterized by their versatility, as they can be used across almost all trading platforms, whether it is software installed directly on the device or some kind of web platform.
The Price Action formation is one of those that the markets very often react as we expect, and in addition, relatively high SL to TP ratios can be achieved.
Strategy entry rules
Entering long positions
- A long falling candle with a long wick followed by a rising inside (a candle that is fully between the High and Low of the previous candle) candle
Entry into short positions
- a long rising candle with a long wick followed by a falling inside (a candle that is fully between the High and Low of the previous candle) candle
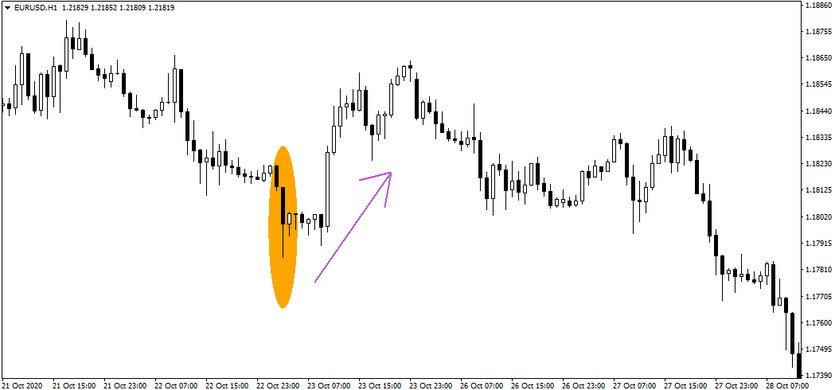
On the chart above, we can see a long descending candle with a relatively long wick, followed by a rising candle whose High and Low were eventually within the previous candle, signaling within today's strategy that a trend change was likely to occur in the near term, which it did.
Note: It is important that the long wick candle be really long compared to the other range "average" candles

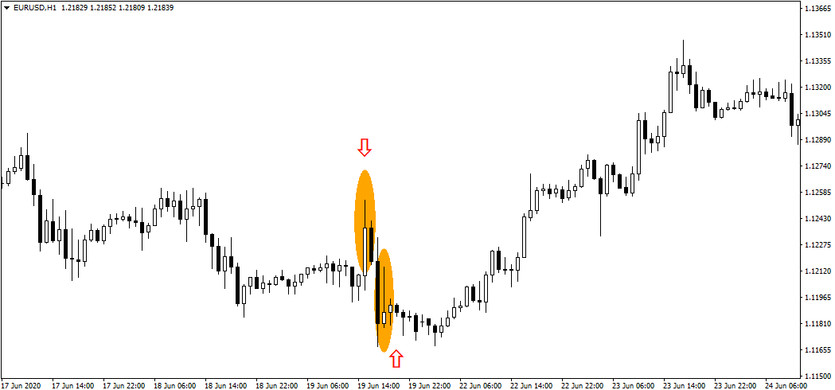
The above chart depicts a less common situation where a sell signal was first created and almost immediately the opposite signal was created. These rapid changes should be watched for as they can quickly change the entire expected trading situation.

With today's Price Action strategy it is possible to achieve a long-term success rate of around 60-70%, which is not much, but the advantage is that if the Stop-Loss is placed at the level of the end of the wick of a long candle, then there should be no problem for the trader to create a well-functioning money-management.


