What are Keltner Channels?
Keltner channels are volatility-based envelopes that are often displayed above and below an exponential moving average. The indicator first appeared in a book in 1960 called “How to Make Money in Commodities” by Chester Keltner. As opposed to Bollinger Bands which use standard deviation, Keltner Channels use the Average True Range (ATR) to define the width of the channel. The parameters to the Keltner Channels indicator are the number of periods to use for the Average True Range (ATR), the multiplier for the Average True Range (ATR) and the number of periods for the exponential moving average.
A Robust Keltner Channels Trading Strategy
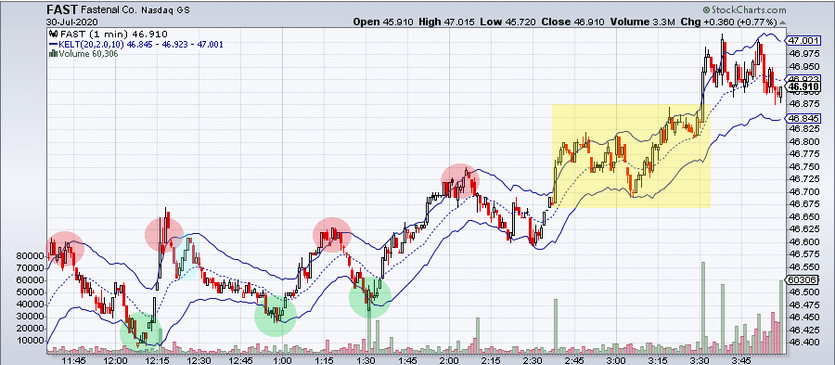
Keltner channels are great for determining when trends are getting overbought or oversold. Consider the following 1-minute chart for Fastenal (NASDAQ:FAST).
We have highlighted four points in the market in red and another three in green. Let’s look at the first red highlighted area. We see here that the price has closed above the upper Keltner channel. This is a trend termination signal. It does not necessarily mean that the trend will reverse, however. As you can see in the yellow highlighted portion, the price crossed above the Keltner channel and move sideways for about an hour. And there are also cases where the price just keeps on moving up, as in the case of a strong trend.
There are two things we can do here. We can:
· Wait for the price to fall and see if it will bounce off the middle band between the two Keltner channels, the exponential moving average.
· We can wait for it to hit the other Keltner channel and see if it bounces off.
The exponential moving average that sits between these two channels is not given much respect by the market. There is a case where this can be used to scalp at the point highlighted in light blue. But for the most part, this chart blows right past this middle band.
So, we wait for the price to close below the lower band of the Keltner channel. When it crosses back above the lower channel, we enter a buy order. We place the stop loss beyond the extreme just created by the push below the lower band to protect our capital in case the trade turns against us.
The take profit is not a set size of value, but when the price exceeds the upper Keltner channel and close back under it. More aggressive traders could also short the same way. More conservative traders would wait for the price to close back (as indicated by the spots highlighted in green) below the lower channel and riding the trade back up to the upper band and then exiting when the price falls back between the bands (as indicated by the spots highlighted in red).
Conclusion
This trading strategy is versatile enough to work for both scalping and longer-term trades. It can be easily automated and works well in ranging markets.