Support and Resistance Boundaries, are probably one of the most watched trading indicators, which can be not only a great helper but also often an evil adversary. And many have already seen this very well.
However, we know from history that the main mistake lies not in the boundaries themselves but in their poor selection, which can turn even the best strategy into a complete nightmare. So don't succumb to the most common mistake and finally start making the right choices.
Strategy entry rules
Entering long positions
- Creating a resistance level (after a "long" rising candle)
- Hitting the resistance level
Entry into short positions
- Creation of a support level (after a "long" declining candle)
- Hitting a support level
How to trade with the strategy
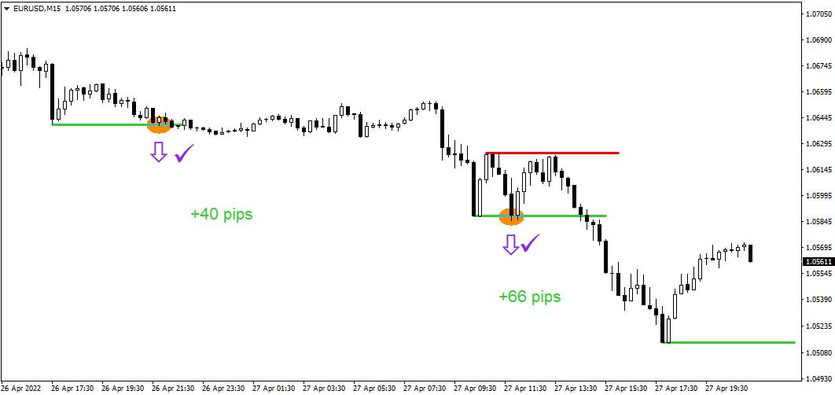
In the above chart you can see a trading session in which today's trading strategy was applied several times.
So let's start from the number (1), where only a support was plotted (the support was preceded by a relatively long falling candle, to which the market subsequently reacted with a rise -> the considerably strong sell side lost a lot here). At point number 2, this support was then hit (sell signal), after which the sell was implemented and there was a period of waiting to see how the situation would develop (SL and TP here were set at a ratio of 1:2, or 20:40pips - subjective choice). Eventually the TP was hit and a profit of +40pips was realized (see chart below).
Subsequently, the market got to point (3), at which point strong support was formed again, and soon thereafter, in addition, resistance was formed at point (4). At point (5), the market hit new support (sell signal), but here it failed to break through this boundary and bounced back (SL, in this case, was placed at the level of the resistance formed (point 4)). Everything here indicated that the trade would end in a loss, but at the last moment it reversed and subsequently recorded another profit of +66pips (again, the ratio of SL:TP = 1:2).
As you can see, since the strategy only uses really strong S/R levels at which a large accumulation of market forces have worn off, if these levels are later broken, so to speak, then the probability of the market reversing thereafter is rapidly reduced and this is where the greatest strength of today's Forex strategy presented here comes from.

Today's strategy based on important support-resistance levels can achieve a success rate in the range of 60-85%, where in this case, however, the biggest influence on the resulting success rate is not only the chosen time frame, but also the choice of traded instruments.


