The Var Mov Avg Fisher is a very smart yet easy to use trading strategy based on the operation of two identical indicators of different periods and a moving average. In combination with each other, these indicators form an effective trading strategy that helps to determine the current trend very accurately, as well as find a successful moment to open positions. The indicators included in the strategy are used for their intended purpose, and therefore it is recommended to familiarize with the trading conditions of these indicators before trading.
Any timeframe and currency pair is suitable for the Var Mov Avg Fisher trading strategy.
Strategy indicators
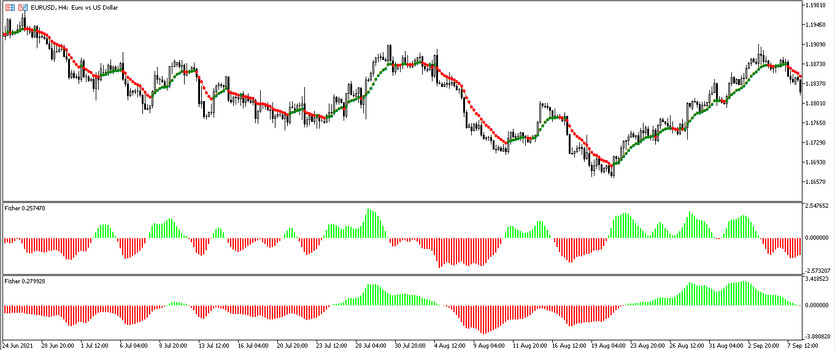
The Var Mov Avg Fisher strategy includes the Var Mov Avg indicators and two Fisher indicators of different periods, one of which is used to determine short-term movements, and the second for long-term movements and also a moving average.
- Var Mov Avg - trend indicator based on the use of a moving average. The indicator settings remain unchanged.
- Fisher - an indicator of the direction and strength of the trend for short-term movements, that is, with a fast period. Its value is set to 10.
- Fisher - an indicator with a slow period for use in long-term movements. Its period is 55.
Making trades using the strategy
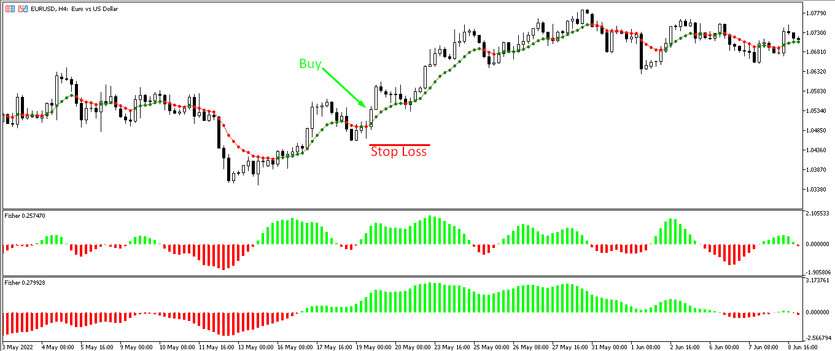
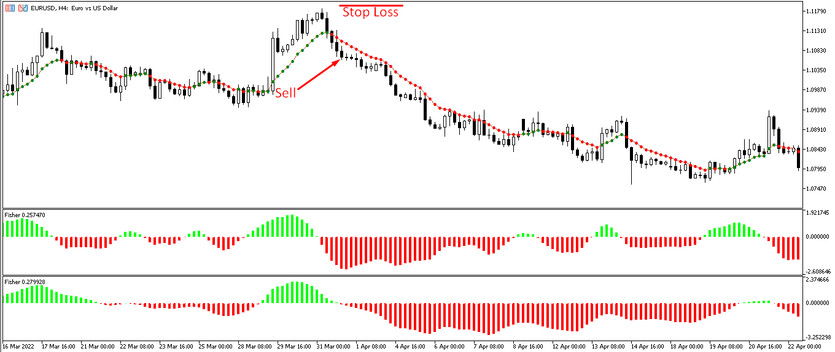
Var Mov Avg Fisher is a very simple and profitable trading strategy, which proves its correct use in practice. First, it should took into account the signals of the two histograms of the Fisher indicator, it is logical that the histogram with a smaller period will give the first signal, and then it will be confirmed by the histogram with a slow period. Therefore, any trade should be opened after Fisher gives a signal with a period of 55. And only then, taking into account the direction and color of the Var Mov Avg indicator, a position can be opened in the direction with the current trend.
Conditions for Buy trades:
- The Fisher 10 indicator, like the Fisher 55, is colored with a growth value, while both are above their level 0.
- The moving average Var Mov Avg moves upwards and is also colored in the color of a hundred by the growth value.
Such indicator conditions correspond to the presence of an uptrend in the current market. And after all the indicator signals coincide on a certain candle, a long position can be opened. Stop loss should be set at the recent local minimum at the lower level of the candle, take profit is not set at all. Instead, the trade is closed manually after the Fisher indicator with a fast period changes its color and direction.

Conditions for Sell trades:
- Fisher indicator histograms are colored with falling value and are below level 0.
- Indicator Var Mov Avg, colored with fall value, moves down.
After these conditions match, a downtrend will be determined and a sell trade can be opened. Stop loss is set at the level of the recent local maximum at the candle base. Instead of setting take profit, the trade is closed upon receipt of reverse conditions from the Fisher indicator with a period of 10.

Conclusion
The Var Mov Avg Fisher trading strategy is very profitable when used correctly, as it is based on effective indicators. To be able to use the strategy correctly and acquire all the necessary skills, it is needed not only to study all the indicators included in it, but also to practice on a demo account first.


