Supports and resistances have been around for several decades, and during that time they have not only been popular, but have also been improved in various ways by countless traders, including some of the best traders at the moment.
We have strategies that are literally time-tested on various instruments, and then, of course, we have those that are time-tested but only achieve great results somewhere. And this is the case with today's strategy, which is tested and performing very well on the currency pair "USDCAD", so if you are one of the devotees of this pair, then do not hesitate to try this strategy as well.
Strategy entry rules
Entering long positions
- Price has passed through the moving average upwards
- the last resistance above the moving average is hit
Entry into short positions
- price has passed through the moving average downwards
- the last support below the moving average is hit
How to trade with the strategy
It may seem that today we have a slightly more complicated strategy, but the opposite is true, because the only thing you need to know is to correctly identify and plot the S/R and then the rest is a walk in the park. So the whole point is that today's strategy uses the USDCAD-H1 currency pair (on other currency pairs the strategy can achieve significantly different results), on which a moving average is applied with the settings shown in the above chart (the average serves as an indicator of the current direction of potential entries) and finally, of course, the aforementioned S/R levels are also used.
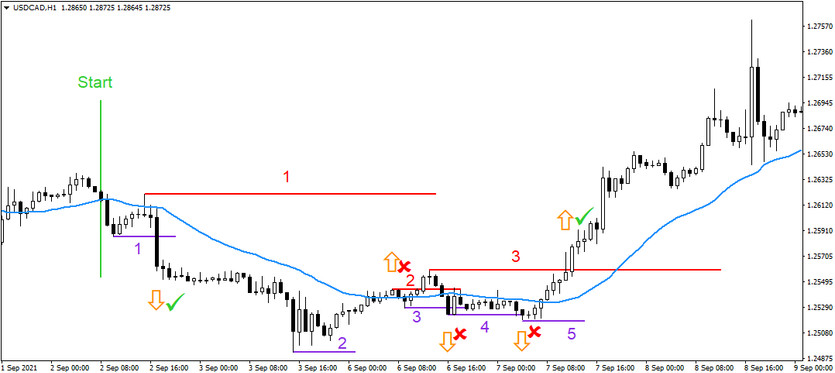
As for the procedure, it will be better to explain it with the help of the situation described in the chart below. So let's start from the beginning, the price first passes through the moving average and forms the first support below the average (purple 1) . It then reverses and forms resistance above the average (red 1). As price subsequently went back down through the average according to the rules and hit the outlined support, it was then possible to enter a short trading position.
Finally, exits from trades always occur with a subsequent hit of the moving average (profitability/loss of the position does not decide). And that's it.
Explanation
If the price had not gone backwards through the average after resistance (1) was formed (it would have remained above it), then if resistance (1) was subsequently hit, then this would not be considered an entry signal and therefore the entry would not have been made (it is always necessary to go through the average and only then hit it). It is also worth mentioning that the only ones that are considered entry supports are those that were formed last after the last downward pass, and by analogy in the case of resistances, it is then the last upward pass.
Chart below - Session trades according to today's strategy
Explanatory notes:
- Start - the beginning of the session
- purple lines - supports
- red lines - resistances
- orange arrows - entries into trading positions
- red crosses - failed trades (recorded loss)
- green filaments - successful trades (ends/finished with profit)

A trading strategy based only on the last support and resistance can achieve a long-term success rate of around 40%, which is more than sufficient given the average low losses and relatively much higher profits.


