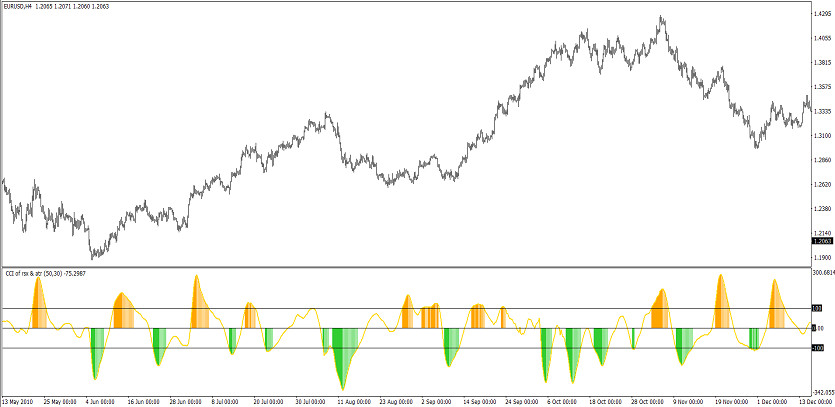
The CCI of RSX ATR indicator is a small trading strategy based on a combination of standard forex indicators. Their interaction forms a special system, the calculations of which are aimed at determining the presence of a trend, its current direction and strength. This, in turn, allows determining the moment of opening a trade. At the same time, this indicator is also suitable for determining the moment the market is in the overbought and oversold zone. The indicator is presented in the lower window of the price chart in the form of a histogram with a signal line, which is painted in a certain color and is located in a certain position relative to its signal levels. The current trend, as well as trades that can be opened during this period are determined taking into account the values of the indicator.
The CCI of RSX ATR indicator is suitable for use on any timeframes with any currency pairs.
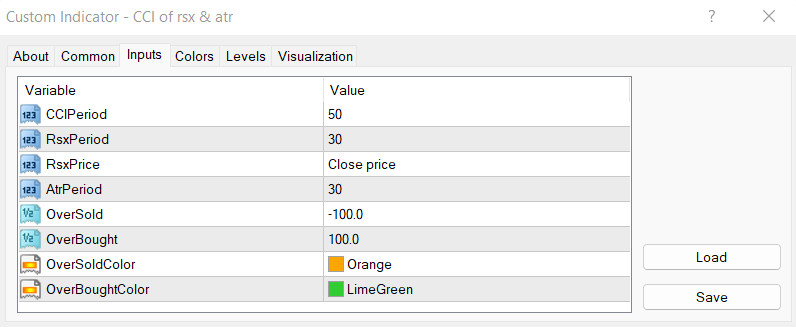
Input parameters
There are several sections in the settings of the CCI of RSX ATR indicator, each of which is responsible for its general functioning. The Input parameters section is responsible for its technical work, the Colors section is for its general visualization, and the Levels section is used to add signal levels to the indicator window.
-CCIPeriod - calculation period of the CCI indicator. The default value is 50.
-RsxPeriod - period of the RSX indicator. The default value is 30.
-RsxPrice - type of price to which the calculations of the RSX indicator are applied. The default value is Close price.
-AtrPeriod - ATR indicator period value. The default value is 30.
-OverSold - the level of the indicator, which is responsible for the market being in the oversold zone. The default value is -100.0.
-OverBought - the level of overbought in the market. The default value is 100.0.
-OverSoldColor - the color of the indicator, which is responsible for oversold conditions. The default value is Orange.
-OverBoughtColor - indicator color with overbought value. Default value is LimeGreen.
Indicator signals
The CCI of RSX ATR indicator is very easy to use. To open a certain trade, it should be taken into account the current trend, namely its strength and direction. Thus, taking into account the direction of the histogram and the signal line, as well as their location relative to the signal levels, the current trend is determined, and thus the direction of the trade. If the current trend is upward, long positions are opened, if the trend is downward, short positions are opened. When the trend changes or weakens, the trades are closed.
Signal for Buy trades:
- The histogram of the indicator has a color with a growth value along with the signal line rises above level 0 to level 100. At the same time, the new histogram column is higher than the previous one.
Upon receipt of such conditions on a signal candle, a buy trade may be opened, due to the presence of an uptrend. If it weakens or changes, namely, upon receipt of the opposite conditions of the indicator, the current trade should be closed and opening new ones should be considered.
Signal for Sell trades:
- Histogram bars have a color with a falling value and fall below level 0 to level -100. In this case, the histogram and the signal line are directed downwards.
A sell trade, due to the presence of a downtrend, is opened when such conditions are received. When receiving reverse conditions from the indicator, that is, when the current trend weakens or changes, the current trade should be closed. At this moment, one should consider opening new trades.
Conclusion
The CCI of RSX ATR indicator is a very powerful trading system, as its calculations are based on the functioning of very powerful forex indicators. Although the indicator is very easy to use, preliminary practice on a demo account is recommended.