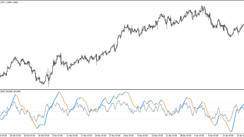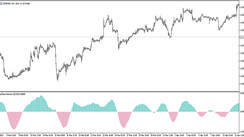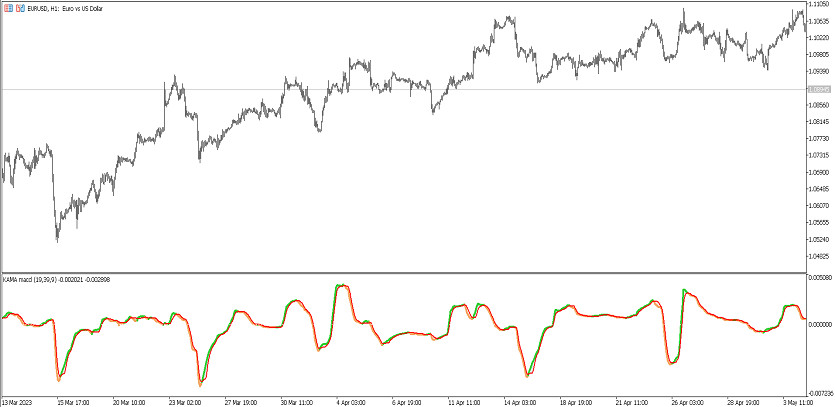
The KAMA MACD indicator is a trading algorithm based on a modification of a standard forex indicator using a non-standard moving average. Its calculations are aimed at determining the strength and direction of the current trend and opening trades in this period. The indicator is presented in the lower window of the price chart as two lines: colored main and MACD lines that intersect each other and move in a certain direction, the distance between them, under certain conditions, is also painted in a certain color. Taking into account the current values of the indicator, the current trend can be determined, taking into account which a certain trade is opened.
The choice of currency pair and trading timeframe does not matter when using the KAMA MACD indicator.
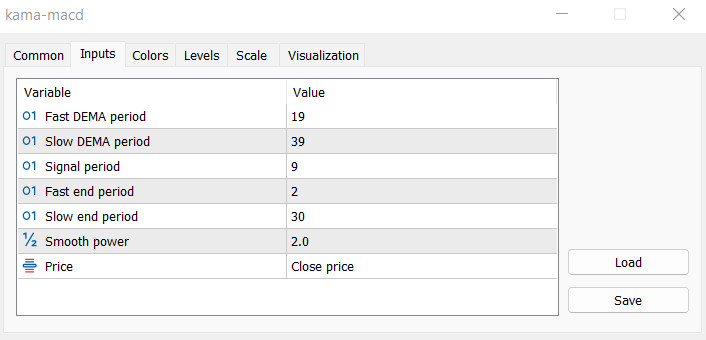
Input parameters
There are several sections in the settings of the KAMA MACD indicator. To change the values of its technical work, use the Input Parameters section, to change the colors - the Colors section, and to add signal levels to the indicator window - the Levels section.
-Fast DEMA period - period of the fast moving average of the indicator. The default value is 19.
-Slow DEMA period - parameter of the period of the indicator's slow line. The default value is 39.
-Signal period - period of calculation of the signal line of the indicator. The default value is 9
-Fast end period - period of fast end of indicator calculations. The default value is 2.
-Slow end period - slow end of indicator calculations. Default value is 30.
-Smooth power - power parameter for smoothing indicator calculations. The default value is 2.0
-Price - type of the price to which the indicator calculations are applied. By default, it has the Close price value.
Indicator signals
To open a certain trade using the KAMA MACD indicator, it is enough to take into account the current trend, which in turn is determined taking into account the direction of its lines, the color of the main one, the color of the distance between them. If the current market trend is upward, long positions are opened, if the trend is downward, short positions are opened. In both cases, trades are closed when the current trend changes.
Signal for Buy trades:
- The indicator lines are directed upwards. The lines intersect so that the main one, which has a color with a growth value higher than the signal one. The distance between the lines also has a growth color.
A buy trade can be opened immediately upon receipt of conditions that characterize the presence of an uptrend. When the current trend changes, namely when a reverse intersection of the indicator lines is received, the current trade should be closed and a new one should be considered.
Signal for Sell trades:
- The main line of the indicator has a color with a growth value and is located below the signal one. Both lines are directed downwards and the space between the lines has a color with a fall value.
Upon receipt of a combination of such conditions on a signal candle, a sell trade may be opened, due to the presence of a downtrend. The trade should be closed at the next crossing of the lines. At this moment, the current trend is expected to change, which will allow considering the opening of new trades.
Conclusion
The KAMA MACD indicator is not only effective but also a very simple and easy-to-use algorithm. Its signals are accurate, as it is based on time-tested indicators. The indicator is suitable for use in various strategies, which in turn will increase the efficiency of trading.