Note: We’ll be taking two weeks off starting from next Monday, and our weekly analysis and the trade signal newsletters will be on pause for that time. We will return with the weekly analysis and trade recommendations from September 6. In the meantime, stay tuned for our long-term Forex outlook that will be published later this week.
US Dollar Fundamental Outlook: Cooler Core CPI Data Takes Steam Out of USD Rally
The US dollar corrected lower last week after the strong rally that started on the first week of August following the robust NFP report. The main event on the calendar was the CPI inflation print on Wednesday, which cooled off compared to previous months. The core CPI number came in line with expectations at 4.3% but, importantly, slower than last month’s 4.5% rate of increase. This “slowdown” in the inflation rate was likely at least part of the reason for the USD’s correction last week, as it means the Fed is in less of a rush to start tapering QE.
Still, last week’s decline is unlikely to reverse the bull dollar trend and is instead likely to be only part of a temporary correction. The reason is that – all being equal – the Fed is firmly on the road to tapering QE, and a 0.2% slower core CPI rate will not deter the US central bank from proceeding with announcing a QE taper, likely to happen in September.
One potential risk (a growing one) is the worsening Covid situation in the US, driven by the spread of the delta variant. While new lockdowns are not likely in the US, traders will closely watch developments on this front as a very high number of new Covid infections could still derail the US economic recovery.
This week the focus is on the FOMC minutes from the July meeting that will be released on Wednesday. Traders will be looking for more hawkish wording that can potentially jumpstart the dollar rally.
Retail sales data will be released tomorrow (Tuesday), where strong numbers are likely to be USD bullish also.
Euro Fundamental Outlook: EUR Recovers but Unlikely to Hold Gains
The euro got a much-needed boost last week, though it’s unlikely that one rebound will change the trends for the common Eurozone currency. Instead, the weaker dollar and the somewhat weaker GBP last week had more to do with the EUR’s rebound than some domestic drivers.
The main dynamics of a dovish ECB for longer will continue to pressure the euro, especially when combined with a growingly hawkish Fed. The negative interest rates in the Eurozone make the EUR an unattractive holding currency, keeping the path of least resistance lower against other currencies with higher interest rates.
The EUR calendar this week is relatively light, featuring 2nd tier data. Flash Eurozone GDP and employment numbers will be released on Tuesday, while the final CPI numbers will be out on Wednesday.
EURUSD Technical Analysis:
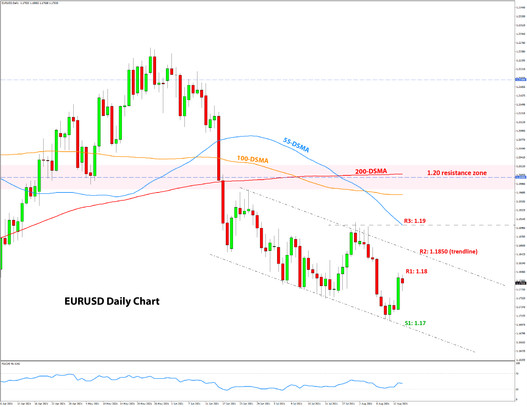
The rebound late last week took EURUSD almost to the 1.18 level and has since stalled there. The bulls may try to take the price higher, but it’s likely that they will encounter stronger resistance at levels above 1.18. This week we are taking a look at the near-term picture for EURUSD on the daily timeframe. For more on our weekly outlook and the potential head and shoulders pattern, see our analysis from last week here.
The daily chart below shows that a new downtrend has formed on the pair, with a resistance trendline coming in around the 1.1850 level. Above it, the 1.19 price zone is also likely to be resistance based on prior highs and the 55-day moving average (blue line). So, on the daily chart, all three round number levels are likely to provide resistance, 1.18, then 1.1850, and then 1.19.
To the downside, support is seen at 1.17, near the most recent lows. If the downtrend channel holds, the projection suggests EURUSD can decline below 1.1650 in the next couple of weeks.
British Pound Fundamental Outlook: Busy Calendar for GBP This Week
The pound ended the past week somewhat lower, although the broader situation for the currency is more range-bound than trending at the moment. The overall fundamentals for the British currency are bullish, as the fast vaccination rollout allowed for a solid economic recovery to start. However, the continued high numbers of daily Covid infections is dampening the good prospects, keeping traders unwilling to take the currency higher for the time being.
The busy calendar for the week ahead may provide some more volatile GBP action. Starting with employment and wage growth on Tuesday, the focus will shift to CPI inflation on Wednesday and then retail sales on Friday. Inflation and unemployment numbers are closely watched by the Bank of England, and therefore can have a sizable impact on GBP, especially in case of deviations from the forecasted figures. In this sense, the risks seem tilted to the bullish side for GBP in case of hotter CPI inflation or better than expected employment reports.
GBPUSD Technical Analysis:
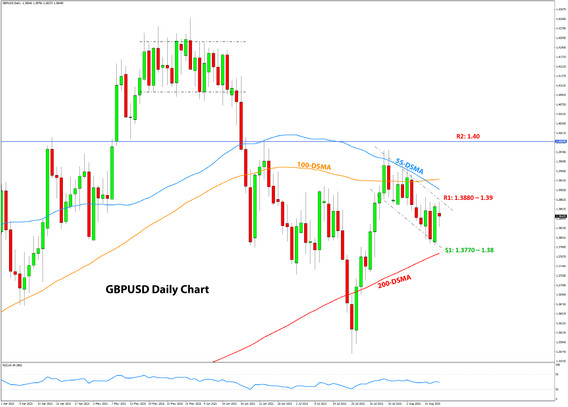
Cable continued with to trade confined to ranges and recorded another doji candlestick on the weekly chart (open price same as closing price).
The daily chart reveals that the consolidation is taking the shape of a bull flag pattern, or rather a downward channel formation. Bull flag patterns within a robust uptrend are usually shorter in duration and shallower. This one in GBPUSD has already retraced 50% of the gains and is already lasting more than the July 20 – July 30 rally. These are signs for caution that suggest a downside resolution to this formation may be just as likely as an upside one.
In terms of the nearby S/R levels, the first resistance is at the channels trendline around 1.3880 – 1.39. The more important resistance remains at the 1.40 zone.
Likewise, support levels are determined from the channel and are therefore moving lower with it. The nearest support is at the trendline and the 200-day moving average in the 1.3770 – 1.38 price zone.

Japanese Yen Fundamental Outlook: JPY Returns as the Strongest Among the Majors; Will it Last?
Last week the yen was the strongest of the eight major Fx currencies, despite the continued rise in stocks and positive risk environment. But the rally in US Treasury yields also reversed partly on Friday and coincided with the decline in USDJPY, which helped the JPY gain ground more broadly against other currencies.
However, it’s questionable how much JPY strength can continue from here (though exactly that is happening today on the open day of the new trading week). US Treasury yields look set to rise further in the coming weeks and months and will hardly be a supportive factor for the JPY. The positive correlation between US yields and USDJPY means that the pair may soon find a bottom. If US yields start rising again, it likely won’t be long before USDJPY trades above 110.00 again.
Versus other major currencies, the JPY may be in better luck. Weakness in the EUR, CHF, and other major currencies could keep JPY strong on the crosses even if USDJPY is rising.
USDJPY Technical Analysis:
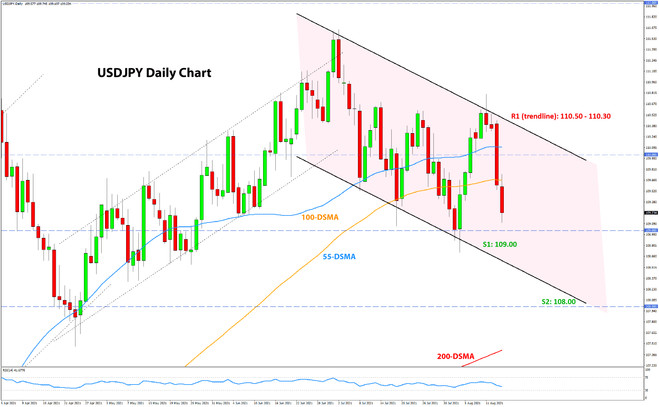
Much as we suspected, USDJPY gave up all the gains last week and is now trading near the 109.00 lows. USDJPY remains stuck in these tight formations that oscillate from ranges to gently-sloped channels. So, again as we said in last week’s analysis, the range-bound dynamics are strongly ingrained in USDJPY price action, and it’s unlikely this will change any time soon. Hence, just as last week this factor argued for a USDJPY decline, this Monday it argues for a rebound as the price is near the support zone and lower end of the chart formation.
The nearest support remains at the 109.00 zone. The next support lower is at 108.00. The first important resistance remains located at the 110.50 zone, though it is moving lower with the falling trendline (see chart).


