US Dollar Fundamental Outlook: Another NFP Miss Is No Great News for the USD (but the Fed Will Still Taper Soon)
Friday’s Nonfarm Payrolls was another miss, showing 192k jobs were created in September, far short of the 500k consensus forecast. However, there were positives too. Average hourly earnings (AHE) and the unemployment rate beat the estimates. Unemployment fell to 4.8%, while AHE accelerated to 0.6% m/m. The overall takeaway from all reports is not that bad for the Fed. Also, the 3-month average of Nonfarm Payrolls is now around 500K, which the Fed probably views as decent, especially as unemployment is falling. So, the Fed is still on track to begin the tapering process of QE purchases soon (the November meeting is the likely date). This should keep the USD at least moderately supported over the months ahead.
In the very near term, however, the NFP disappointment can take some steam out of the dollar rally (think this week and next). This is because theNFP miss practically ensures that when the Fed announces tapering, it will be a very dovish announcement. And this part can keep the dollar contained in the near term. But as noted above, further out into the future, the dollar should still remain strong as the US economy outperforms Europe and others, and the Fed is ahead of other central banks in tightening monetary policy.
This week’s busy US calendar will get the most attention on Wednesday when CPI inflation and the FOMC minutes will be released at 2:30 and 8:00 CET each. Special focus will be placed on the core CPI component, which is expected to have risen by 4.0% y/y. A hotter number than this may revive the USD bull trend, while a weaker number would probably reinforce the USD correction from last week.
The FOMC minutes will likely pass quietly, though there is potential for volatility if it contains any unexpected hawkish or dovish lines. Other US data of interest will be JOLTS job openings tomorrow (Tuesday) and retail sales Friday.
Euro Fundamental Outlook: Vladimir Putin Calms the Gas Market; Is a Modest EUR Recovery on the Cards This Week?
There are certainly not many positives going around for the euro these days, but perhaps fewer negatives could set the stage for a small recovery this week. Gas prices corrected lower last week after Russian President Putin said Gazprom will deliver more gas to Europe this winter. The main issue with gas prices was low supplies from Russia (guess, due to complicated politics), and Putin’s statement came at the right time to calm the nerves. The peak in gas prices (and coupled with the NFP miss) could prove to be a reason for a modest recovery in EURUSD this week, but “modest” would most likely be it.
Beyond the very short term, the focus will remain on the slowing Eurozone economy, which will keep the ECB dovish for much longer than other central banks. Also, gas prices in Europe will stay high throughout the winter (even with increased supplies), and this will certainly remain another headwind for the economy. On balance, the bearish longer-term EUR fundamentals are intact, but there is scope for a rebound this week due to technical factors and because the currency is somewhat oversold.
As for EUR calendar events, the focus will be on speeches by ECB’s chief economist Philip Lane today and tomorrow (Tuesday). His views have often been influential on the euro exchange rates, so traders will keep a close eye on his words. Other notable events on the calendar are the German ZEW economic sentiment index and industrial production data.
EURUSD Technical Analysis:
EURUSD stopped the downtrend at the confluence support around the 100-day (orange) and 200-day (red) moving averages. The more narrowly defined support area here is 1.1550, but the zone could stretch all the way down to below 1.15 (March 2020 Covid highs). While the downtrend still seems intact, and the bearish head and shoulders pattern keeps the downside target fixated at the 1.12 area, it’s important to keep in mind that the support here could cause some short-term setbacks at least.
Last week’s candle, with the tall wicks and a small body, is suggestive that EURUSD could retrace higher from here. However, this candle formation is not a bullish pattern, so in this sense, there is no bullish signal here yet. It will be, therefore, no surprise if the predominant downtrend pushes EURUSD further lower this week.
If, however, a correction does come, then the first resistance is seen around the 1.1650 lows, the next one is at 1.17, and finally, 1.1750 should hold back any rallies to keep the downtrend in place.
British Pound Fundamental Outlook: GBP Rises Again as Speculation for BOE Hikes Comes Back
GBP staged a comeback against the euro and the dollar last week driven by renewed speculation for earlier BOE rate hikes. Like in most parts of the world, inflation has been accelerating in recent months, but the Bank of England seems less tolerant of the higher inflation compared to, e.g., the Fed and the ECB. This has supported the pound. And while a hawkish central bank is bullish for a currency, it’s questionable how much longer-term support the GBP can draw on this story because business indicators and growth are slowing at the same time. Raising rates in a slowing economy is not a recipe to support the economy.
These are the two narratives that are pulling GBP in different directions at the moment. Ultimately, the probabilities favor a lower path, as the economic deceleration should limit the potential for BOE hawkishness over the coming months. This week will also be a big test as the UK reports 1st-tier reports such as employment and GDP. If these print weaker than expectations, the GBP would most likely slide again in resumption of the late September sell-off.
The UK calendar also features other 2nd-tier data such as industrial and manufacturing production, trade balance, and construction output. Several MPC members will also speak throughout the week, and it will be a key focus for Fx traders to interpret their guidance for BOE rate hikes.
Overall, the busy calendar suggests that the pound can be very volatile this week and potentially swing in both directions as a result of these events.
GBPUSD Technical Analysis:
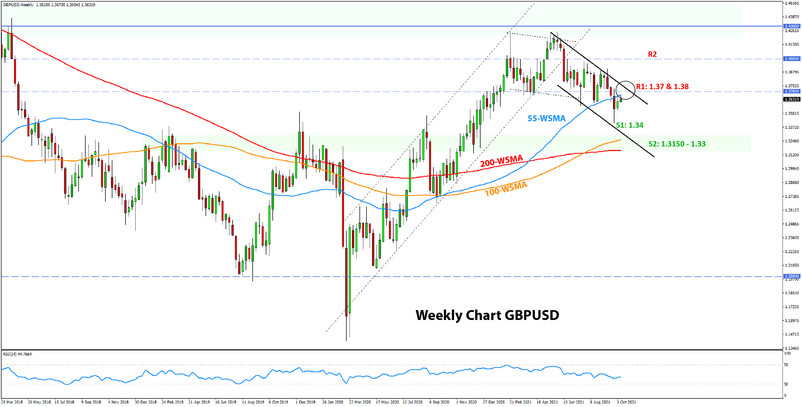
Last week, cable extended the rebound off the September 30 lows and is now trading above 1.36 again, which was arguably a notable resistance due to the 3 pivotal lows on the daily chart. But rest assured, there are more resistance zones on the way up. The next one is 1.37, and then the upper end of the channel around 1.38 will provide resistance further up. The channel’s falling trendline also concurs with the 100-day and 200-day moving averages (not shown in the chart below).
While the price has now repeatedly broken 1.36, this level remains an important one for GBPUSD, nevertheless. A renewed bearish break of 1.36 would likely signal that another attack on the 1.34 lows is becoming very possible, or potentially even lower.
On the other hand, the bulls will only be confident that they are taking control here if they start conquering levels above 1.38, which for now, seems like a distant land.

Japanese Yen Fundamental Outlook: Stocks rebound, Yields Rise, and JPY Declines
The JPY sell-off is accelerating today in an extension of the weakness from last week, but it is not driven by an unusual theme for the yen. Stocks rebounded while Treasury yields continued to march higher last week. The perfect mix for JPY weakness.
Domestically, politics will remain a hot topic as Japan prepares to hold a Parliamentary election on the 31st of this month. The new LDP leader and current PM Kishida will try to win a nationwide election after inheriting the role from his predecessor. Fumio Kishida is seen as a continuation of Shinzo Abe’s expansive and dovish economic policies, and this fact could very well be adding additional selling pressures on the yen recently.
Global risk sentiment, equity indices, and US Treasury yields will remain the main drivers of the yen. For the time being, all are green, keeping the path of least resistance lower for the Japanese currency.
USDJPY Technical Analysis:
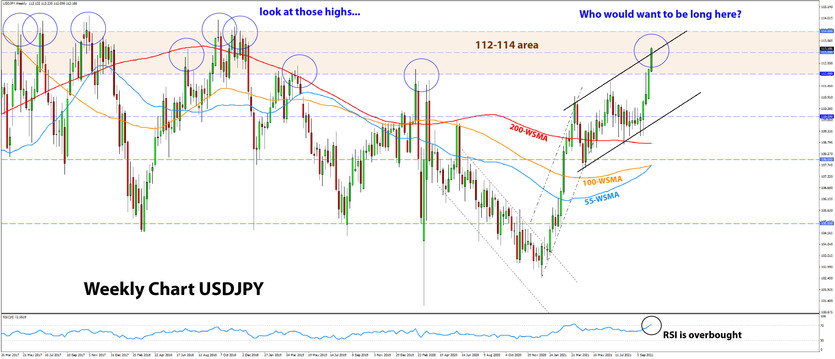
USDJPY continues to march higher this week and has already moved above 113.00. In our recent weeklies, we noted this area as a key resistance zone based on the upper end of the channel that has formed here since March/April this year.
Furthermore, a quick glance at the chart below shows us that 112.00 – 114.00 is a historically important area for USDJPY, where the price has peaked many times in the past 4-5 years. Could this be a sign that another peak is near? There is only one way to find out, and that’s letting the market tell us. In spite of the strong uptrend, another discouraging sign for adding longs here is the overbought weekly RSI (currently 72.30). I wouldn’t want to be long here!
Looking at support levels to the downside, the previous swing highs at the 112.00 and 111.00 round numbers are likely to be the first zones where buy orders may be located.


