USD Fundamentals: Correction Entering Unjustified Territory
The dollar extended the correction lower last week, with the DXY reaching levels last seen in June. The USD move down came despite the fact that the main events that traders were watching (Powell’s speech and Nonfarm Payrolls) did not give any apparent reason for the pronounced bearish USD reaction. For instance, Powell was not overly dovish (no hint on rate cuts), and the Nonfarm payrolls report was better than the forecasts. Other data released last week was also generally near consensus forecasts and provided no reason for the sell-off.
Instead, it seems the market continues to trade the “peak inflation”, and the “central banks will soon pivot” stories. This is evident from the big jump in stocks, for example, a clear reflection of risk-taking and improved sentiment. Another reason that explains the recent USD decline is positioning and end-of-year rebalancing flows. The dollar rose substantially throughout 2022, and now as the year approaches, fund managers are taking profits and rebalancing their portfolios. This can be enough to drive such a sharp technical correction.
With all that being said, this USD correction is now becoming a little too deep, too soon. It doesn’t seem justified by the fundamentals, especially as the US economy is still running in much better shape than Europe and the rest (as last week’s NFP and jobs reports showed). Thus, it will come as no surprise if this USD move down is soon stopped in its tracks and reversed, particularly considering that the dollar has already fallen a lot and the DXY index is getting oversold.
Another evidence of the strength of the US economy came already today (Dec 5) in the much stronger than expected ISM services report. It printed 56.5 vs forecasts of 53.3, indicating strength of the US economy. However, for the immediate near term, we may see some consolidation and range trading as the market takes a pause in preparation for the next big week when CPI inflation and the Fed meeting take place. Further big USD losses seem unlikely, but equality, a bullish reversal doesn’t look imminent either.
EUR Fundamentals: Is This Too Much EUR-Optimism?
The euro extended its resilient performance and ended the past week stronger versus most other major currency peers. It is rising in tandem with global risk sentiment, especially vs the US dollar (EURUSD higher). However,
The main focus on the Eurozone calendar last week was the flash CPI inflation report. Similarly to the US inflation report from November 10, Eurozone inflation missed expectations last week, coming in at 10.0% vs 10.4% consensus estimates. This confirms our premise that if US inflation starts falling, Eurozone inflation will fall even faster. In turn, if the Fed “pivots’ dovishly, the ECB will surely turn dovish even more aggressively. Long-term, this should continue to be a bearish EURUSD driver.
However, none of this is reflected in a weaker euro yet. Instead, the currency kept rising, which is suggestive that factors other than pure fundamentals are currently in the driving seat of the Fx market. This often means that such moves are duly reversed.
In the meantime, European gas prices (TTF contract) and electricity prices have started to rise again as the weather turns colder. Back in October and November, the warm weather across Europe lowered gas prices, which helped the euro start a recovery. The question is, how much longer can this EUR rally last if those factors no longer support it?
The Eurozone calendar is very light this week, save for some speeches from ECB President Lagarde. Like the Fed, the ECB also meets next week, which is another reason why the Fx market may consolidate over the coming days in anticipation of the big events.
EURUSD Technical Analysis:
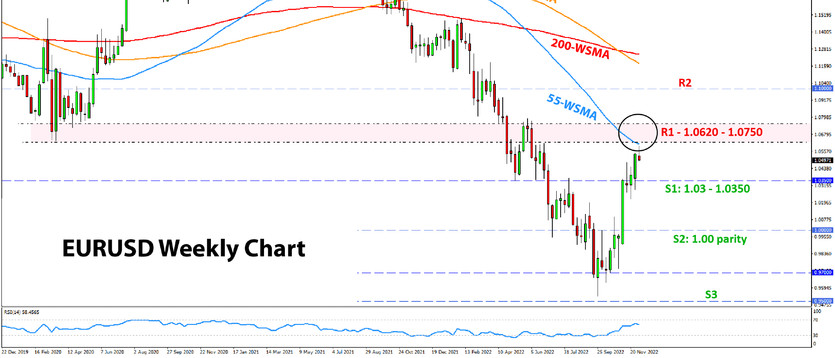
EURUSD managed to break above 1.05 in Monday trading today but hit the resistance area that stands above 1.06. Essentially, this is the 0620 - 1.0750 area, which represents big resistance due to multiple factors like Fib levels and important previous lows (from Covid March 2020 crash).
Some reaction here at the 0620 - 1.0750 area is very likely, as we are already seeing today. A further test higher is certainly possible as the resistance stretches all the way to 1.0750. However, it also could be that EURUSD only touches this area and reverses. It could be the perfect setup to re-enter short, and the market action will remain the best guide for that. A bearish signal or pattern on lower timeframes could give an early hint whether EURUSD will test further higher to 1.0750 or reverse sooner.
To the downside, the 1.03 – 1.0350 zone is the first support ahead of parity (1.00).
GBP Fundamentals: Risk Sentiment Remains Resilient, Will It Last?
Sterling is extending the run higher as global risk sentiment made a comeback last week and equities rose. GBP was among the top-performing currencies as the cocktail of lower global bond yields and higher stock markets boosted risk appetite.
Much like the rest of the Fx market, the main driver of GBP moves now seems to be global macro factors and the risk environment. In this sense, a lot will depend on what happens next with the broad US dollar trend and moves in bond and stock markets. Given central banks’ strong resolve to fight inflation with tight policy, the supportive environment for risk appetite doesn’t look likely to last. This (assuming risk aversion eventually returns) should prove bearish GBP in the coming weeks and months.
Regarding domestic UK factors, there isn’t much fuel left in the tank to drive the GBP further higher from the optimism about the change of the UK Government. Some progress on the Northern Ireland protocol is also reflected in GBP’s exchange rates at these levels. So, the recent positives from domestic UK politics are less likely to fuel a further GBP rally from now on.
The very light calendar schedule continues until next week when the BOE also meets, just hours apart from the Fed and the ECB. In a way, this week could be the calm before the storm for the GBPUSD.
GBPUSD Technical Analysis:
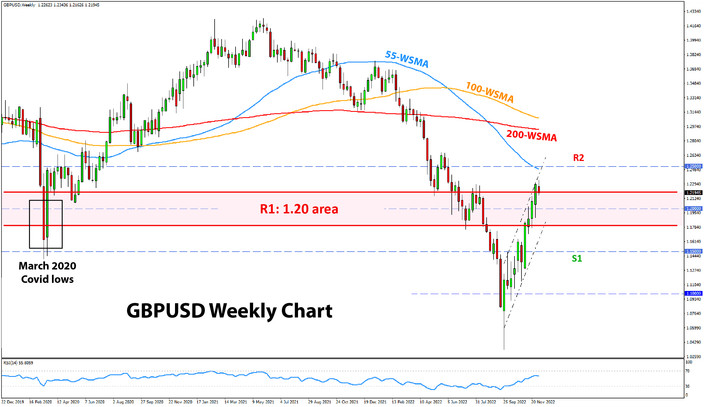
GBPUSD is also at a big resistance area that is centred around the historically important 1.20 level. But the whole monthly/weekly resistance based on it stretches between 1.18 and 1.22, making this a wide long-term resistance area. This means that GBPUSD could still reverse here even if it trades above or around these levels for some time.
To confirm the weekly resistance is holding, the bears need GBPUSD to drop back below 1.20. This would be a bearish signal in the current context and will open the way for a larger move toward 1.15, which is the next support zone lower.
To the upside, the pair is already at the upper end of the long-term resistance area. Nonetheless, in case the move higher continues (though it looks unlikely), the focus will turn to the 1.25 zone as the next resistance.

JPY Fundamentals: Correction Extends as “Peak Inflation” Story Is the Main Driver
The yen extended the gains, ending the past week as one of the strongest currencies in the Fx market. A further decline in US Treasury yields across all durations (2-year, 5-year, 10-year, and 30-year yields all declined) is the driver behind the reversal lower in USDJPY and, by extension, in other JPY pairs.
This comes much as a reversal of the main factor that contributed to the massive JPY declines for most of this year. Thus, the main question for JPY traders now is what happens next with US Treasuries, in particular with the 10-year yield. This has hit a big support zone around 3.5%, and further declines seem much harder to come by. If US yields do bottom here, that could mean that USDJPY is close to a bottom too.
The quiet Fx calendar for this week could mean that JPY pairs take a quiet period too. The next BOJ meeting is on December 20, and it could be a pivotal event for the yen. Given the recent sharp JPY strengthening, some retracement of those moves makes sense as traders scale back positions ahead of the volatile trading around central bank events. USDJPY could climb closer to 140.00 by the time of the Fed meeting next Wednesday (Dec 14).
USDJPY Technical Analysis:
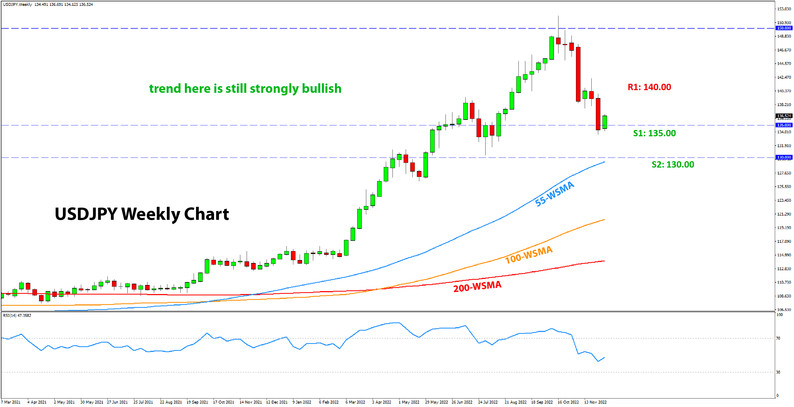
USDJPY is approaching important support areas on the weekly chart. It has already reached the 135.00 area, where it is bouncing, but a reversal is not confirmed yet. The top on the weekly chart is definetely confirmed now. The main question is whether this bounce at 135.00 will be big enough or USDJPY will first test 130.00 before a bigger recovery.
A move above 140.00 would signal that some short-term bottom of the retracement is in. If USDJPY climbs above 140.00 quickly from here, it could also signal a fast recovery and potentially resumption of the bullish trend. Above 140.00, the next resistance is likely to be found at 145.00.
To the downside,130.00 is the obvious focus as a key support area. It is where the 55 weekly moving average and the important highs and lows from May and August are located. In this long-term context, 130.00 seems like the most significant support for USDJPY currently.
Finally, it’s worth remembering that despite the recent 1600-1700 pips decline, the trend on USDJPY is still clearly bullish. The current correction is merely a 38.2% retracement of the whole USDJPY uptrend starting two years ago. A 38.2% Fib correction only categorizes as a shallow retracement.


