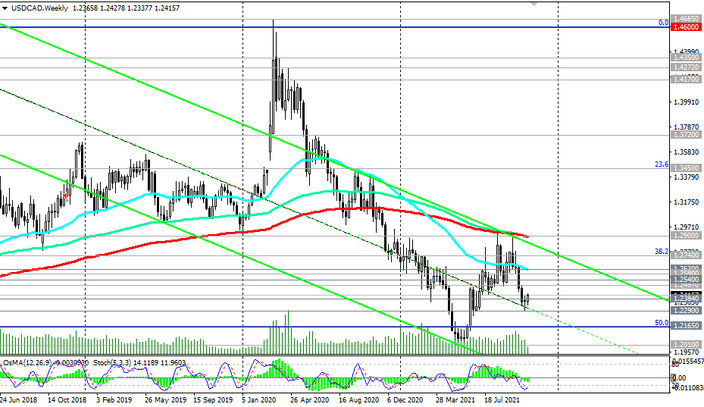
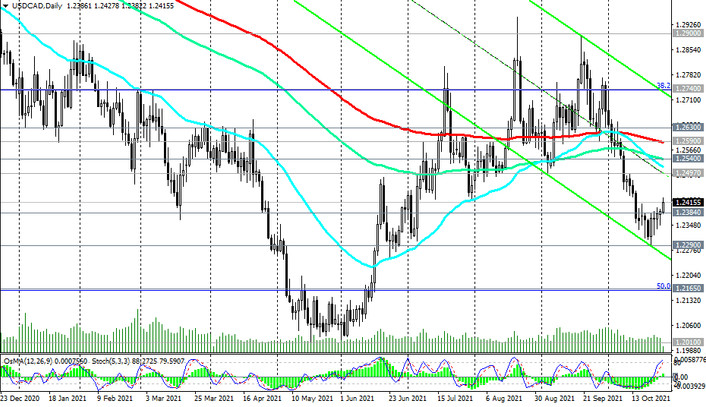
USD / CAD is traded in the bear market zone, staying below the key resistance levels 1.2525 (ЕМА200 on the monthly chart), 1.2590 (ЕМА200 on the daily chart), 1.2900 (ЕМА200 on the weekly chart).

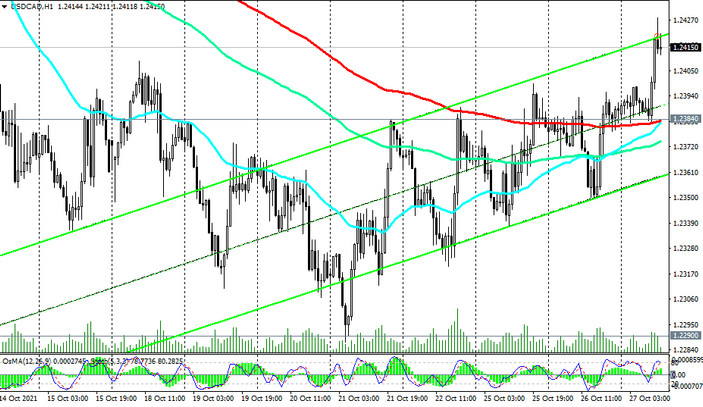
However, one should also pay attention to yesterday's breakdown of the important short-term resistance level 1.2384 (ЕМА200 on the 1-hour chart), which is the first signal of an upward correction that has begun.

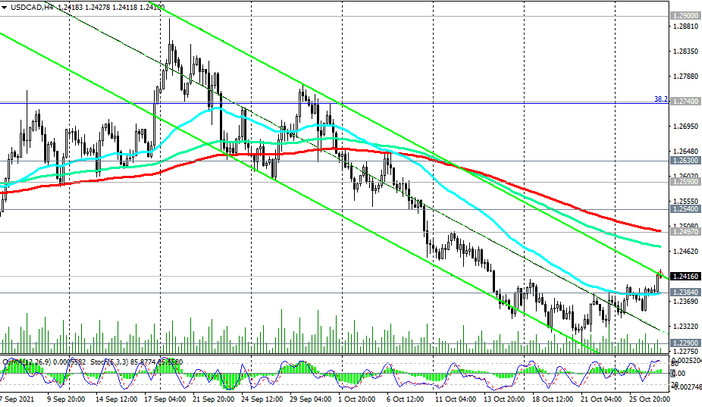
Its nearest target is near the resistance level 1.2497 (ЕМА200 on the 4-hour chart). In case of its breakdown and further growth, the target will be the key resistance levels 1.2590, 1.2630 (ЕМА50 on the weekly chart).

However, only a breakdown of the resistance level 1.2900 can indicate the end of the USD / CAD downtrend.
So far, the downward trend prevails, and the breakdown of the support level 1.2384 will mark the resumption of the USD / CAD downtrend with targets at support levels 1.2290 (local 4-month lows), 1.2165 (Fibonacci level 50% of the downward correction in the wave of USD / CAD growth from 0.9700 to 1.4600), 1.1580 (Fibonacci level 61.8%, the lower border of the descending channel on the weekly chart).

Support levels: 1.2384, 1.2290, 1.2165, 1.2010, 1.1580
Resistance levels: 1.2497, 1.2540, 1.2590, 1.2630, 1.2740, 1.2900
Trading scenarios
Sell Stop 1.2375. Stop-Loss 1.2435. Take-Profit 1.2290, 1.2200, 1.2165, 1.2010, 1.1580
Buy Stop 1.2435. Stop-Loss 1.2375. Take-Profit 1.2497, 1.2540, 1.2590, 1.2630, 1.2740, 1.2900


