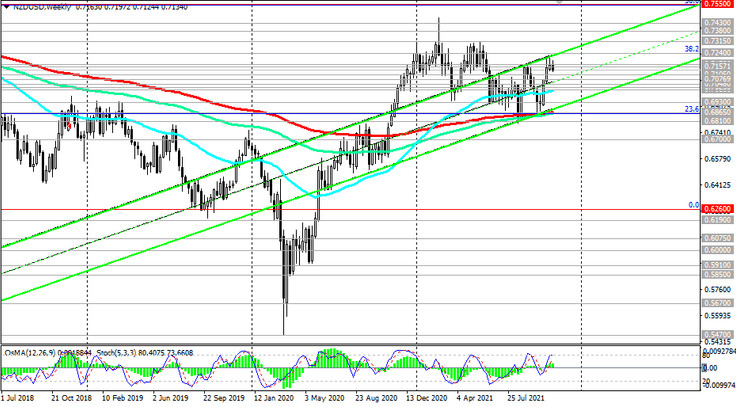
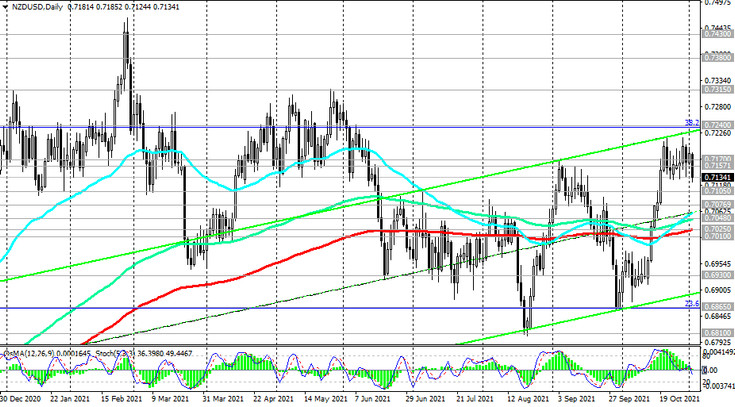
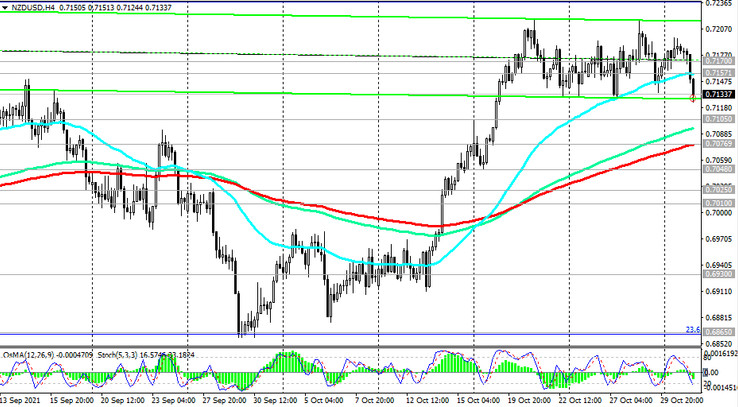
As we noted above, NZD / USD remains in the bull market zone, trading above the key support levels 0.6865 (ЕМА200 on the weekly chart and 23.6% Fibonacci retracement in the global wave of the pair's decline from 0.8820), 0.7025 (ЕМА200 on the daily chart). At the time of publication of this article, the NZD / USD pair is near the 0.7134 mark.

A breakdown of the important short-term support level 0.7157 (ЕМА200 on the 1-hour chart) indicates a possible beginning of a downward correction. Its target is near the 0.7077 mark, through which another important support level (ЕМА200 on the 4-hour chart) passes.

In the event of a downward correction and its breakdown, NZD / USD may drop to the zone of key support levels 0.7025, 0.7010 (ЕМА50 on the weekly chart).

Above these levels, there is a long-term bull market zone. Nevertheless, only a breakdown of the key support level 0.6865 carries the threat of breaking the long-term bullish trend in NZD / USD.
Long positions are still preferred above this level.
But the breakout of the support levels 0.6865, 0.6810 (local 12-month lows could finally push NZD / USD into the bear market zone and return it to the global downtrend that began in July 2014.
Thus, a breakdown of the resistance level 0.7157 will be a signal for the resumption of long positions. More distant growth targets are located at resistance levels 0.7240 (Fibonacci level 38.2%), 0.7430, 0.7550 (Fibonacci level 50%), 0.7600.

Support levels: 0.7105, 0.7077, 0.7048, 0.7025, 0.7010, 0.6930, 0.6865, 0.6810, 0.6750, 0.6700
Resistance levels: 0.7157, 0.7170, 0.7240, 0.7315, 0.7380, 0.7430, 0.7550, 0.7600
Trading recommendations
Sell Stop 0.7120. Stop-Loss 0.7165. Take-Profit 0.7105, 0.7077, 0.7048, 0.7025, 0.7010, 0.6930, 0.6865, 0.6810, 0.6750, 0.6700
Buy Stop 0.7165. Stop-Loss 0.7120. Take-Profit 0.7240, 0.7315, 0.7380, 0.7430, 0.7550, 0.7600


