

Currently, GBP / USD is traded near the 1.3625 mark, returning to the levels of the beginning of this year.
Earlier this month, the price broke through the important support level 1.3705 (ЕМА200 on 1-hour, 4-hour, daily GBP / USD charts).
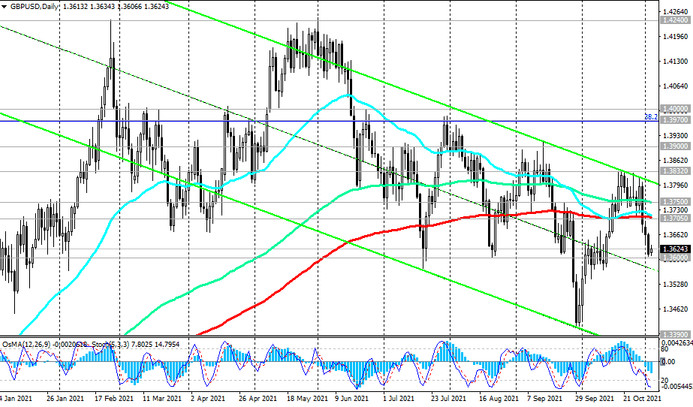
The pair is declining within the descending channels on the daily and weekly charts. The breakout of support levels 1.3390 (ЕМА200 on the weekly chart), 1.3210 (the lower border of the descending channel on the weekly chart and the 23.6% Fibonacci level of the correction to the decline of the GBP / USD pair in the wave that began in July 2014 near the level of 1.7200) will finally return GBP / USD to a long-term bear market.
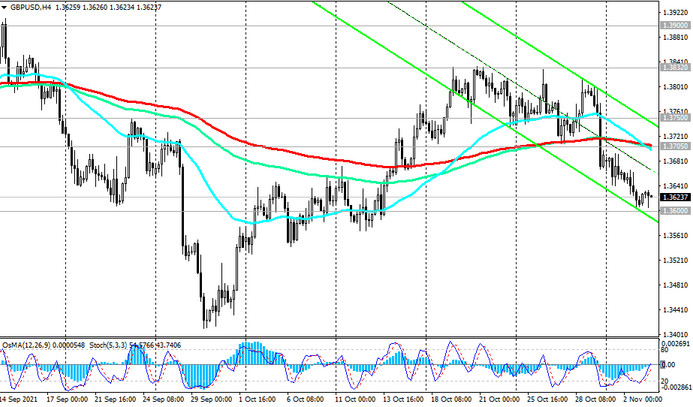
In an alternative scenario, GBP / USD will resume its growth. A signal for the resumption of purchases will be the breakdown of the resistance level 1.3705, and the breakdown of the local resistance level 1.3832 will create preconditions for further growth of GBP / USD towards the resistance levels 1.3900, 1.3970 (Fibonacci level 38.2%), 1.4000.
Support levels: 1.3600, 1.3500, 1.3420, 1.3390, 1.3210
Resistance levels: 1.3705, 1.3750, 1.3832, 1.3900, 1.3970, 1.4000
Trading recommendations
Sell Stop 1.3585. Stop-Loss 1.3655. Take-Profit 1.3500, 1.3420, 1.3390, 1.3210
Buy Stop 1.3655. Stop-Loss 1.3585. Take-Profit 1.3705, 1.3750, 1.3832, 1.3900, 1.3970, 1.4000


