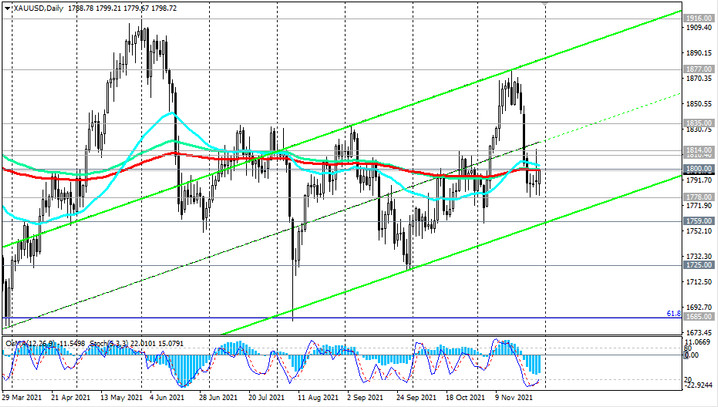
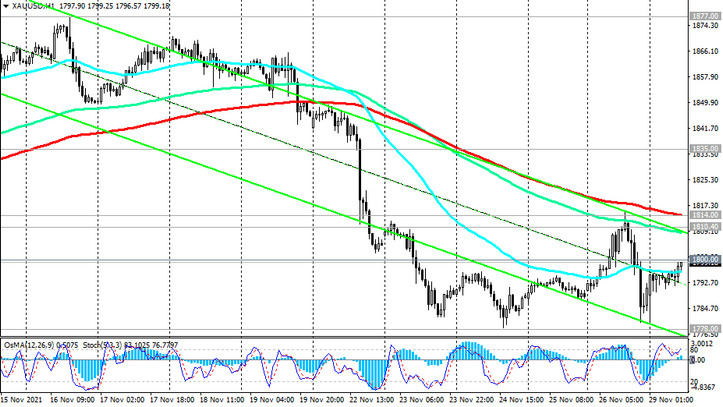
As we noted above, the XAU / USD pair is again testing for the breakout of the important resistance level 1800.00 (ЕМА200, ЕМА144 on the daily chart and ЕМА50 on the weekly chart). This mark also became, around since the beginning of 2021, psychologically significant.

A confirmed breakdown of the resistance level 1800.00 may trigger further growth in XAU / USD. However, in order to open new buy deals, it is probably still better to wait for a more confident growth of XAU / USD, for example, above the mark of 1815.00, corresponding to the recent local highs, while an important short-term resistance level passes through the mark of 1814.00 (ЕМА200 at 1- hour chart). In this scenario, the growth of XAU / USD will continue towards the local maximum 1877.00 and the upper border of the ascending channel on the daily chart with an intermediate target at the resistance level 1835.00 (local highs). Breakdown of the local resistance level 1877.00 will create preconditions for further growth of the pair.
In an alternative scenario, and after a return into the zone below 1778.00, the XAU / USD will continue to decline towards support levels 1759.00 (local lows and the lower border of the ascending channel on the daily chart), 1725.00 (local lows), 1685.00 (ЕМА144 on the weekly chart and Fibonacci level 61,8% of the correction to the growth wave since November 2015 and the mark of 1050.00), 1620.00 (ЕМА200 on the weekly chart).

A breakdown of the support level 1560.00 (Fibonacci level 50%) will increase the risks of breaking the long-term bullish trend XAU / USD.
Support levels: 1778.00, 1759.00, 1725.00, 1685.00, 1620.00, 1560.00
Resistance levels: 1800.00, 1810.00, 1814.00, 1835.00, 1877.00, 1900.00, 1916.00, 1963.00, 1976.00, 2000.00, 2010.00
Trading recommendations
Sell Stop 1777.00. Stop-Loss 1805.00. Take-Profit 1759.00, 1725.00, 1685.00, 1620.00, 1560.00
Buy Stop 1815.00. Stop-Loss 1795.00. Take-Profit 1835.00, 1877.00, 1900.00, 1916.00, 1963.00, 1976.00, 2000.00, 2010.00


