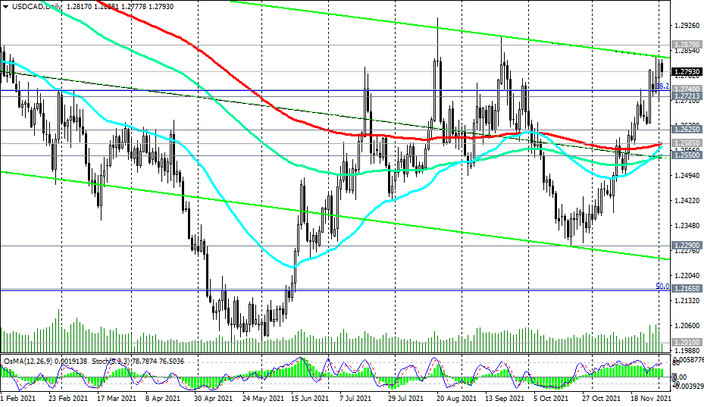
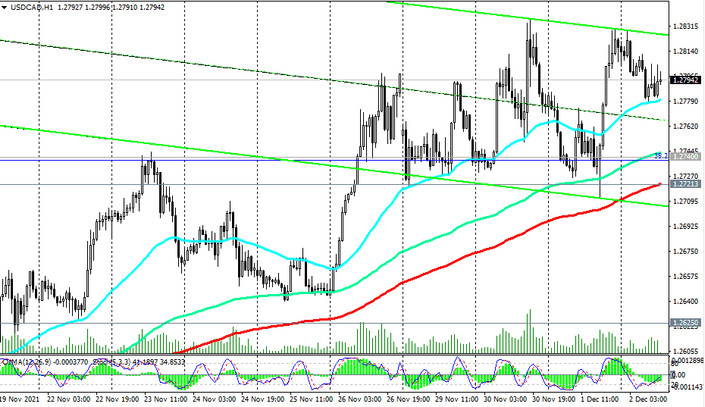
Since the beginning of last month, USD / CAD has been developing upward dynamics against the background of the strengthening of the US dollar due to the increased likelihood of an imminent increase in the FRS interest rate. The pair is traded well above the important long-term support level 1.2585 (EMA200 on the daily chart). The breakdown of the key resistance level 1.2870 (ЕМА200 on the weekly chart) will mean the final completion of the downward correction and the return of USD / CAD into the zone of the long-term bull market.

In an alternative scenario, the decline in USD / CAD will resume, and the first signal for the resumption of short positions will be a breakdown of the important short-term support level 1.2721 (ЕМА200 on the 1-hour chart) and support level 1.2740 (Fibonacci level 38.2% of the downward correction in the wave of USD / CAD growth from the level of 0.9700 to the level of 1.4600) with the target at the support level of 1.2585. A breakdown of the key support level 1.2550 (ЕМА200 on the monthly chart) will mean a return of USD / CAD to the bear market zone.

Support levels: 1.2740, 1.2721, 1.2625, 1.2585, 1.2550, 1.2290, 1.2165, 1.2010
Resistance levels: 1.2870, 1.2900
Trading scenarios
Sell Stop 1.2770. Stop-Loss 1.2840. Take-Profit 1.2740, 1.2721, 1.2625, 1.2585, 1.2550, 1.2290, 1.2165, 1.2010
Buy Stop 1.2840. Stop-Loss 1.2770. Take-Profit 1.2870, 1.2900, 1.3000, 1.3200


