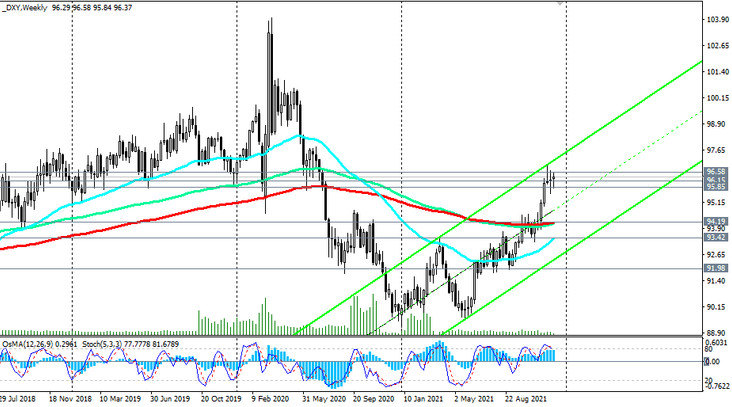
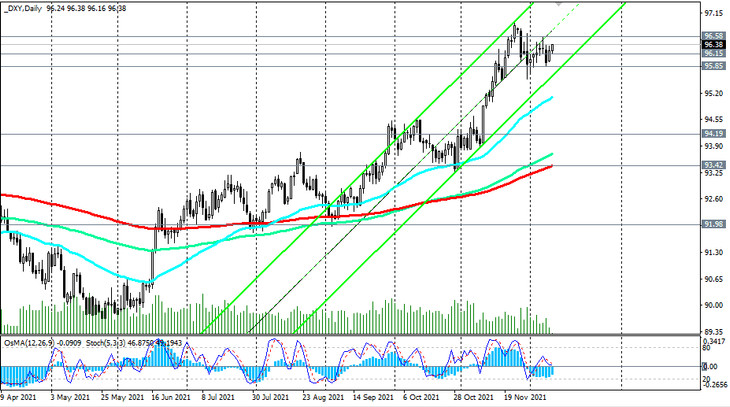
Since the beginning of this year, the DXY dollar index has been developing upward. The price of DXY futures finally returned to the bull market zone, breaking through the key long-term resistance level 91.98 (ЕМА200, ЕМА144 on the monthly chart) in August, and then (in November) the long-term resistance level 94.19 (ЕМА200, ЕМА144 on the weekly chart).

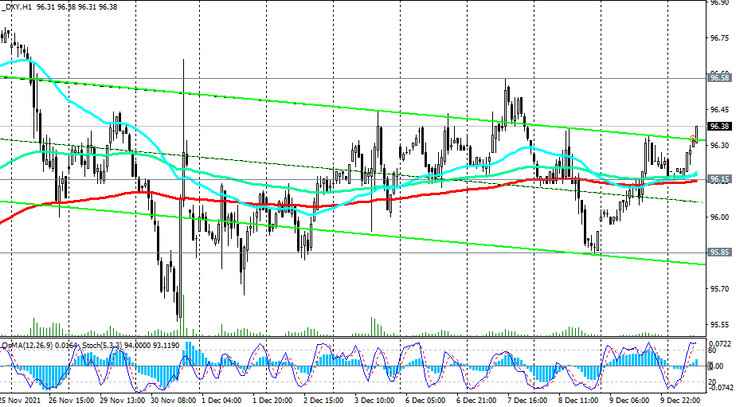
Since the beginning of December, DXY futures have been trading in a range between local highs near 96.94 and local lows near 95.54, reached at the end of November, while maintaining positive dynamics and an inclination to further growth.
At least, this is evidenced by the technical indicators OsMA and Stochastic on the charts of short-term (1-hour and 4-hour) and long-term (weekly and monthly) periods.
In case of a breakdown of the upper border of the above-mentioned range, passing through the mark of 96.58, the price will rush towards the recent 16-month local maximum of 96.94 and further to the psychologically significant mark of 100.00 with the prospect of further growth.

In an alternative scenario, the first signal to sell DXY futures will be a breakout of the important short-term support level 96.15 (ЕМА200 on the 1-hour chart), and a confirmation signal will be a breakdown of the lower border of the range that goes through the mark of 95.85.

However, in the current situation, long positions on the DXY are preferable due to expectations of further strengthening of the dollar ahead of the Fed meeting next week and the gradual withdrawal of stimulus programs by the US central bank leaders.
Support levels: 96.15, 95.85, 95.48, 95.10, 94.19, 93.42, 91.98
Resistance levels: 96.58, 96.94, 98.00, 99.00, 100.00
Trading scenarios
Sell Stop 95.83. Stop-Loss 96.60. Take-Profit 95.48, 95.10, 94.19, 93.42, 91.98
Buy Stop 96.60. Stop-Loss 95.83. Take-Profit 96.94, 98.00, 99.00, 100.00


