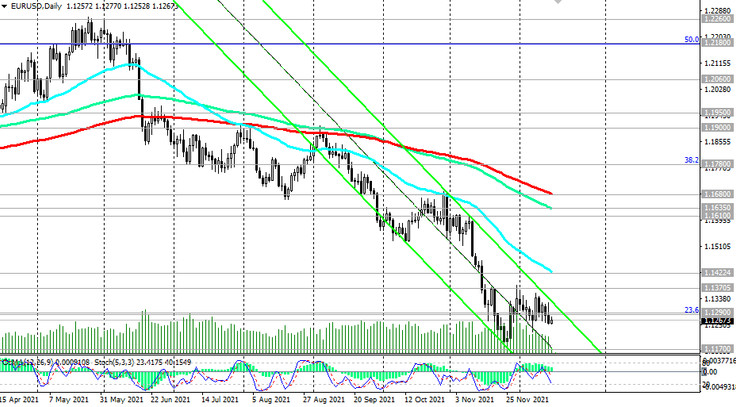
In June 2021, the EUR / USD downtrend resumed. At the end of October, the pair broke through the long-term key support level 1.1610 (ЕМА200 on the weekly chart) and accelerated its decline in November, renewing 17-month lows at 1.1186.
The pressure on the pair towards its further decline is maintained against the background of different directions of the monetary policies of the ECB and the FRS and expectations of further strengthening of the dollar.

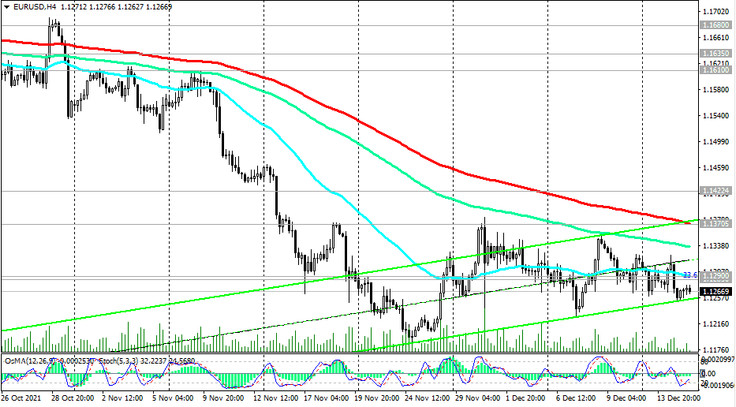
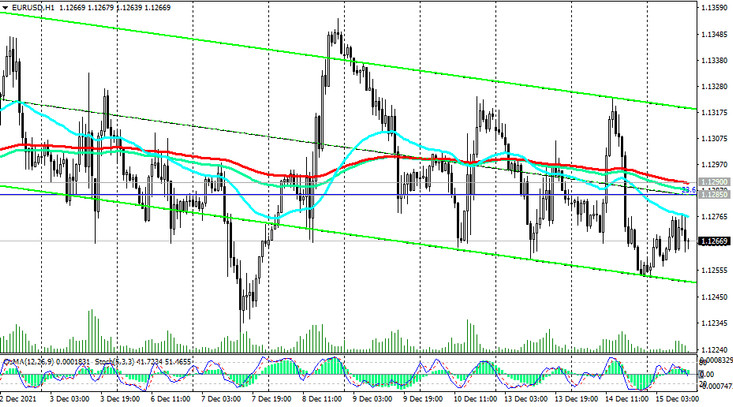
At the time of this article publication, EUR / USD is traded near 1.1267, remaining within the descending channels on the daily and weekly charts. A breakdown of the local support level 1.1186 will be a signal for a further decline, first to the 1.1100 mark, and then towards the March 2020 lows, recorded near the 1.0700 mark.

In an alternative scenario, corrective growth of EUR / USD will begin, and the first signal for it will be a breakdown of the nearest resistance levels 1.1285 (Fibonacci level 23.6% of the upward correction in the wave of the pair's decline from the mark of 1.3870, which began in May 2014, to the mark of 1.0500), 1.1290 (ЕМА200 on the 1-hour chart). The target of the corrective growth is resistance levels 1.1370 (ЕМА200 on the 4-hour chart), 1.1420 (ЕМА50 on the daily chart). Above is unlikely. The negative dynamics of EUR / USD prevails. Further decline is most likely.

Support levels: 1.1200, 1.1186, 1.1170, 1.1100, 1.0900, 1.0800, 1.0700
Resistance levels: 1.1285, 1.1290, 1.1370, 1.1420, 1.1500, 1.1610, 1.1635, 1.1680, 1.1700
Trading Recommendations
Sell Stop 1.1250. Stop-Loss 1.1330. Take-Profit 1.1200, 1.1186, 1.1170, 1.1100, 1.0900, 1.0800, 1.0700
Buy Stop 1.1330. Stop-Loss 1.1250. Take-Profit 1.1370, 1.1420, 1.1500, 1.1610, 1.1635, 1.1680, 1.1700


