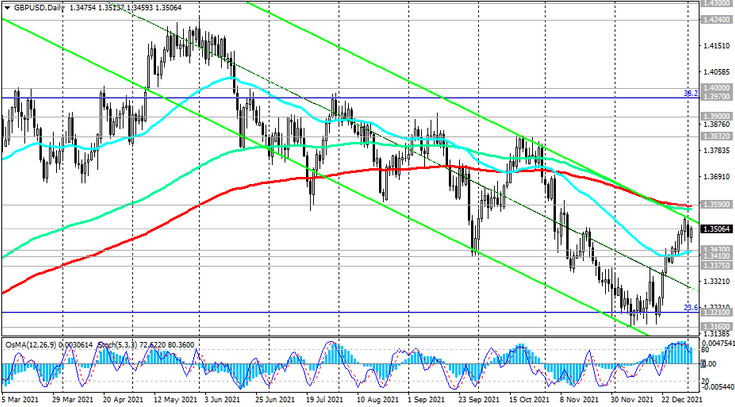
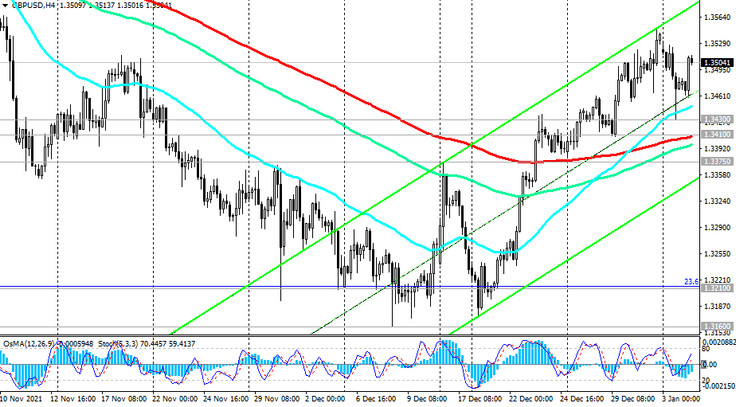
Having tested an important support level (Fibonacci level 23.6% of the correction to the decline in the wave that began in July 2014 near the level of 1.7200), GBP / USD rebounded from it and rose by 2.3% to the current mark of 1.3505, breaking through important resistance level 1.3430 (ЕМА50 on the daily chart). Nevertheless, the current growth in GBP / USD should still be viewed as corrective, and the main scenario for now is a long-term decline within the bearish trend.

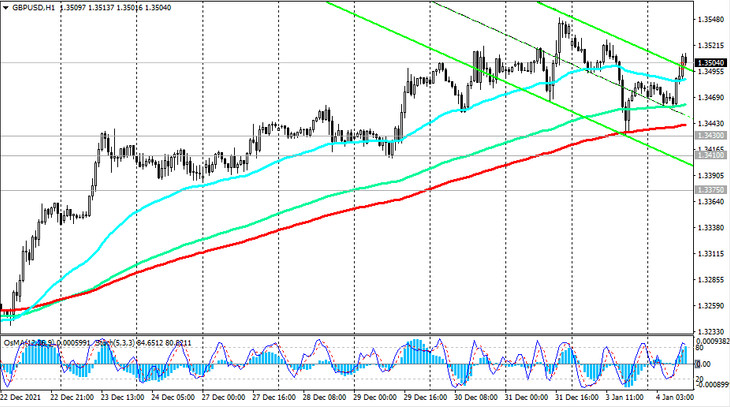
However, in order to resume short positions, you should still wait for the price to return into the zone below the support level 1.3410 (ЕМА200 on the 4-hour chart), and the breakdown of the support level 1.3440 (ЕМА200 on the 1-hour chart) will be the first signal for this. A breakdown of the local support level 1.3160 will open the way for a decline towards 1.3000, 1.2700.

In an alternative scenario, the corrective growth of GBP / USD will continue, and its target may be resistance levels 1.3590 (ЕМА200 on the daily chart), 1.3600. Their breakdown may signal the end of the GBP / USD downtrend.

Support levels: 1.3440, 1.3430, 1.3410, 1.3375, 1.3300, 1.3210, 1.3160, 1.3000, 1.2865, 1.2685
Resistance levels: 1.3590, 1.3700, 1.3832, 1.3900, 1.3970, 1.4000
Trading recommendations
Sell Stop 1.3450. Stop-Loss 1.3530. Take-Profit 1.3440, 1.3430, 1.3410, 1.3375, 1.3300, 1.3210, 1.3160, 1.3000, 1.2865, 1.2685
Buy Stop 1.3530. Stop-Loss 1.3450. Take-Profit 1.3590, 1.3700, 1.3832, 1.3900, 1.3970, 1.4000


