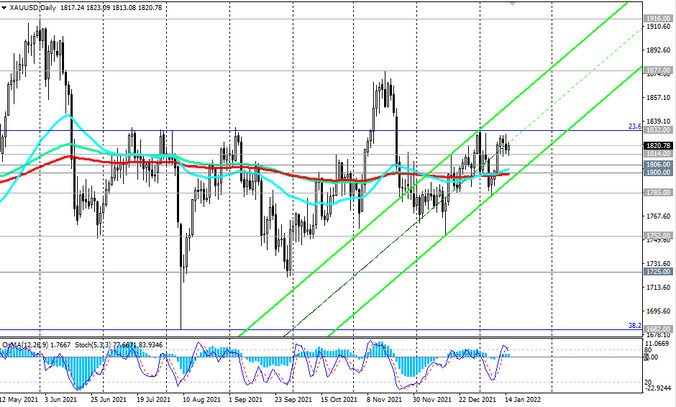
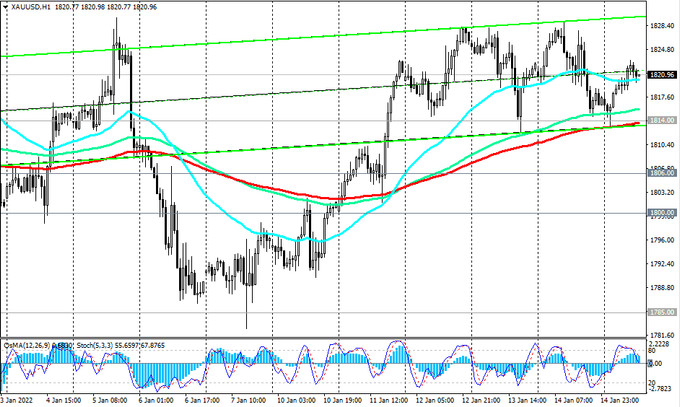
As we noted above, in case of a breakdown of the upper limit of the wide range passing through 1916.00, XAU/USD has a chance to rise towards multi-year highs near 2000.00. Anyway, above the short-term support level 1814.00 (EMA200 on the 1-hour chart), long positions remain preferable. A breakdown of the resistance level 1832.00 (Fibonacci level 23.6% of the correction to the growth wave from December 2015 and the mark of 1050.00) will be a signal to increase long positions.

In an alternative scenario, and after a retest of the key long-term and psychologically important support level 1800.00, XAU/USD will head towards the lower border of a wide range passing through 1682.00 (38.2% Fibonacci level) with intermediate targets at support levels 1785.00, 1752.00. A breakdown of the support levels 1635.00 (EMA200 on the weekly chart), 1560.00 (50% Fibonacci level) will increase the risks of breaking the long-term bullish trend of XAU/USD. The first signal for the implementation of this alternative scenario will be a breakdown of the support level 1814.00.

Support levels: 1814.00, 1806.00, 1800.00, 1785.00, 1752.00, 1725.00, 1682.00, 1635.00, 1560.00
Resistance levels: 1832.00, 1877.00, 1900.00, 1916.00, 1963.00, 1976.00, 2000.00, 2010.00
Trading recommendations
Sell Stop 1811.00. Stop Loss 1830.00. Take-Profit 1806.00, 1800.00, 1785.00, 1752.00, 1725.00, 1682.00, 1635.00, 1560.00
Buy Stop 1830.00. Stop Loss 1811.00. Take-Profit 1832.00, 1877.00, 1900.00, 1916.00, 1963.00, 1976.00, 2000.00, 2010.00


