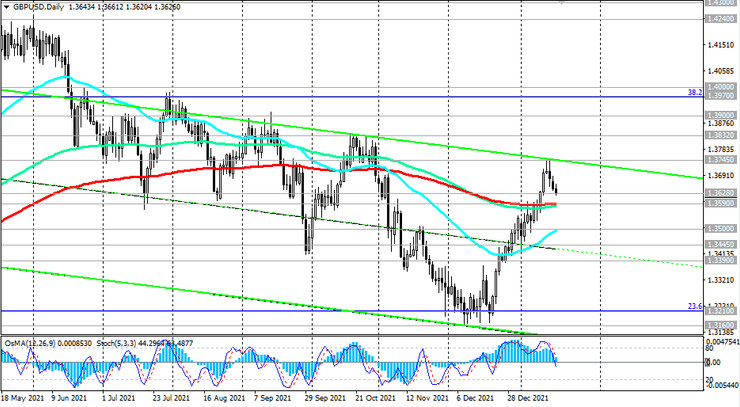
And yet, there is one alarming moment for holding long positions and the upward dynamics of the GBP/USD. The pair failed to develop an upward trend, retreating from the local high of 1.3745 reached last week.

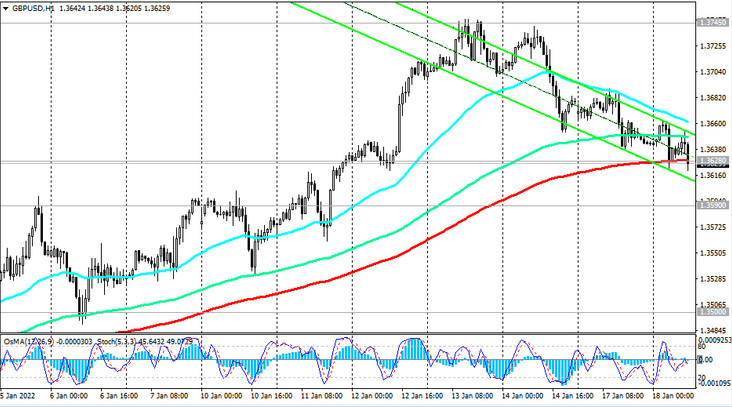
On the 1-hour chart of GBP/USD, the price broke the important short-term support at 1.3628 (200-period moving average). This is the first signal to open short positions on GBP/USD. A break of the key support level 1.3590 (the 200-period moving average on the daily chart) will be a confirmation signal. A break of the support level 1.3390 (200-period moving average on the weekly chart) will bring GBP/USD back into the bear market.

An alternative scenario will be associated with the resumption of the upward dynamics of the GBP/USD. Breakdown of the local resistance level 1.3660 will be the first signal for the implementation of this scenario with an intermediate target at the local resistance level near 1.3745.
Support levels: 1.3628, 1.3590, 1.3500, 1.3445, 1.3390, 1.3300, 1.3210, 1.3160, 1.3000, 1.2865, 1.2685
Resistance levels: 1.3660, 1.3700, 1.3745, 1.3832, 1.3900, 1.3970, 1.4000
Trading recommendations
Sell Stop 1.3610. Stop Loss 1.3670. Take-Profit 1.3590, 1.3500, 1.3445, 1.3390, 1.3300, 1.3210, 1.3160, 1.3000, 1.2865, 1.2685
Buy Stop 1.3670. Stop Loss 1.3610. Take-Profit 1.3700, 1.3745, 1.3832, 1.3900, 1.3970, 1.4000


