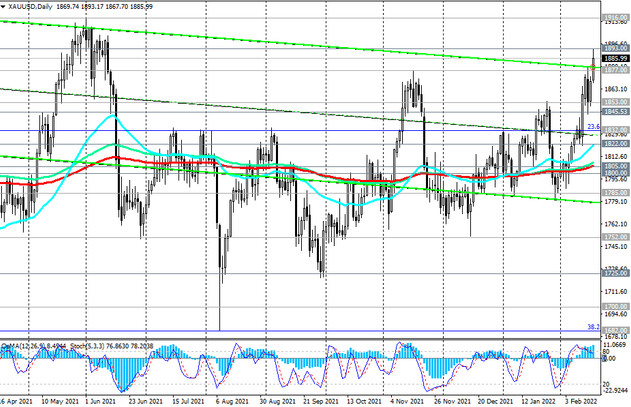
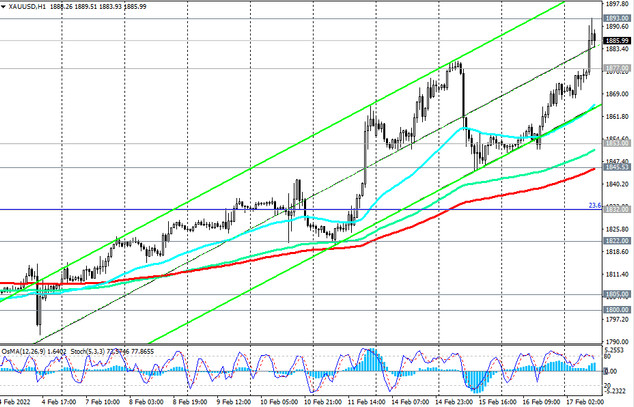
At the time of writing this article, the XAU/USD pair is traded near 1885.00, remaining in a long-term bull market and moving within an ascending channel on the weekly chart. Its upper limit is close to 1916.00 (local highs in 2021). This mark will be a reference in case of further growth of XAU/USD and after the breakdown of today's local resistance level 1893.00.
Data coming out of the US point to accelerating inflation, which puts pressure on the Fed to tighten monetary policy as aggressively as possible. And the closer the March meeting of the US Federal Reserve, the stronger the volatility in the quotes of the dollar and gold will grow. In the meantime, long positions look preferable in the XAU/USD pair.

In an alternative scenario, XAU/USD will return to the key long-term and psychologically important support level 1800.00. The first signal for the implementation of this scenario will be a breakdown of the local support level 1877.00, and a breakdown of the support levels 1853.00 and 1845.00 (EMA200 on the 1-hour chart) will confirm this scenario.

In case of further decline, XAU/USD will head towards the bottom of the range (between 1752.00 and 1877.00) and further towards the bottom of the wider range passing through 1682.00 (Fibonacci 38.2% retracement of the up wave since December 2015 and marks 1050.00). A breakdown of the support levels 1640.00 (EMA200 on the weekly chart), 1560.00 (50% Fibonacci level) will increase the risks of breaking the long-term bullish trend of XAU/USD.
Support levels: 1877.00 1853.00 1845.00 1832.00 1822.00 1805.00 1800.00 1785.00 1752.00 1725.00 1700.00 1682.00 1640.00 1560.0
Resistance levels: 1893.00, 1900.00, 1916.00, 1963.00, 1976.00, 2000.00, 2010.00
Trading recommendations
Sell Stop 1866.00. Stop Loss 1894.00. Take-Profit 1853.00 1845.00 1832.00 1822.00 1805.00 1800.00 1785.00 1752.00 1725.00 1700.00 1682.00 1640.00 1560.00
Buy Stop 1894.00. Stop Loss 1866.00. Take-Profit 1900.00, 1916.00, 1963.00, 1976.00, 2000.00, 2010.00


