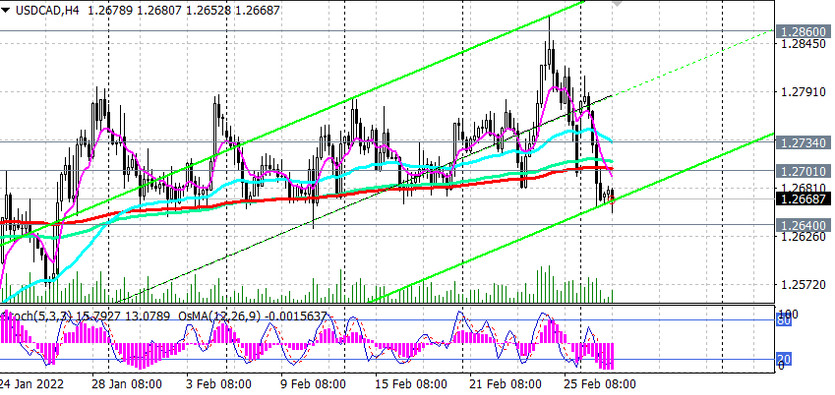
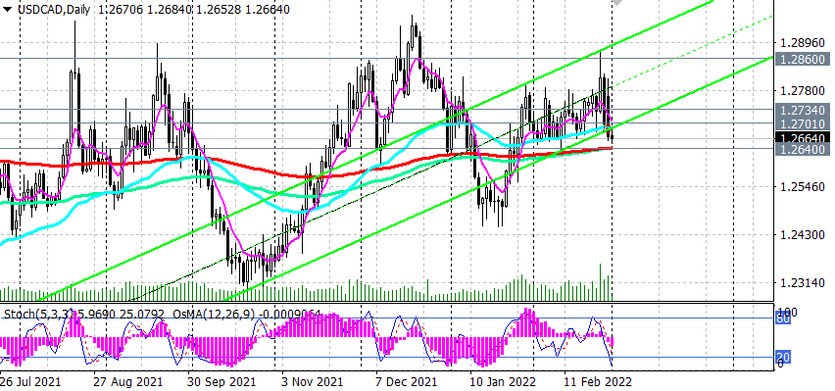
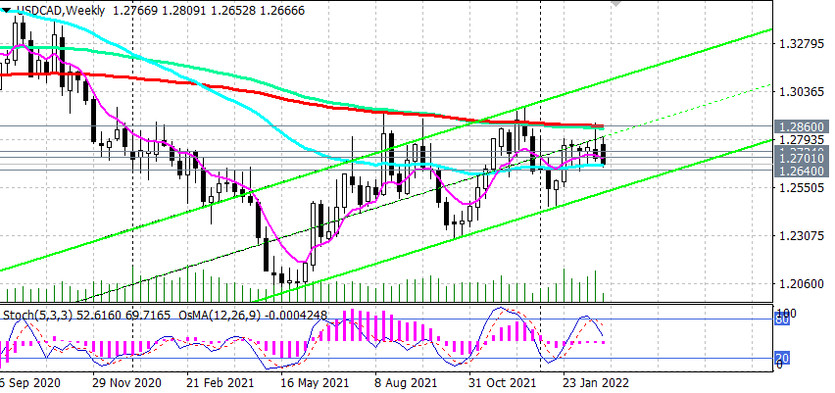
As we noted above, USD/CAD is currently traded mainly in the bear market zone, below the key resistance level 1.2860 (EMA200 on the weekly chart). USD/CAD is also below the important short-term resistance levels 1.2734 (EMA200 on the 1-hour chart), 1.2701 (EMA200 on the 4-hour chart).
Technical indicators OsMA and Stochastic on 4-hour, daily, weekly charts also recommend short positions.
In the event of a breakdown of the key support level 1.2640 (EMA200 on the daily chart), USD/CAD will finally move into the long-term bear market zone.
In an alternative scenario, the first signal for resuming purchases will be a breakdown of the resistance level 1.2701, and the confirmation signal will be a breakdown of the resistance level 1.2734 with the nearest target at the resistance level 1.2860.
Due to a variety of multidirectional factors, it is still difficult to determine the direction of the longer-term dynamics of USD/CAD.
Probably, closer to the middle of March, the Fed meeting and its future plans will come to the fore again. But there may also be unexpected decisions in the light of heightened geopolitical tensions in Europe. In the meantime, USD/CAD movement in the range between 1.2640 and 1.2860 levels seems to be the most likely.
Support levels: 1.2640, 1.2600, 1.2540, 1.2455, 1.2290, 1.2165, 1.2010
Resistance levels: 1.2701, 1.2734, 1.2785, 1.2800, 1.2860, 1.2900, 1.2960, 1.3100
Trading Scenarios
Sell Stop 1.2635. Stop-Loss 1.2710. Take-Profit 1.2600, 1.2540, 1.2455, 1.2290, 1.2165, 1.2010
Buy Stop 1.2710. Stop-Loss 1.2635. Take-Profit 1.2734, 1.2785, 1.2800, 1.2860, 1.2900, 1.2960, 1.3100