As we noted above, at the time of publication of this article, the XAU/USD pair is traded near the 1938.00 mark, remaining in the zone of a long-term bull market and moving within an ascending channel on the daily chart.
Its upper border passes near the mark of 1990.00, above the local 17-month maximum of 1974.00 reached last week. The mark of 1990.00 will be a reference point in case of further growth of XAU/USD and after the breakdown of the local resistance level 1974.00.
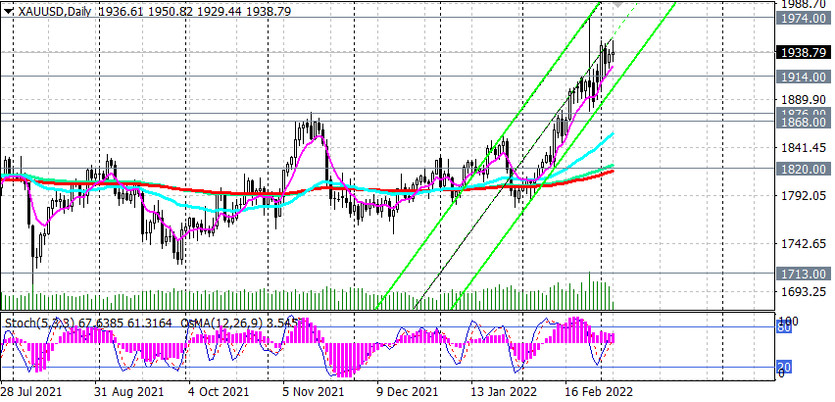
A more distant target, which so far looks theoretical, is 2074.00, reached in August 2020. But who knows... Data coming out of the US points to a rapid acceleration of inflation, which the Fed may simply not be able to keep up with if it takes a less aggressive stance on monetary policy than markets expect. And the closer the March meeting of the Fed, the stronger the volatility in the quotes of the dollar and gold will grow. In the meantime, long positions look preferable in the XAU/USD pair.
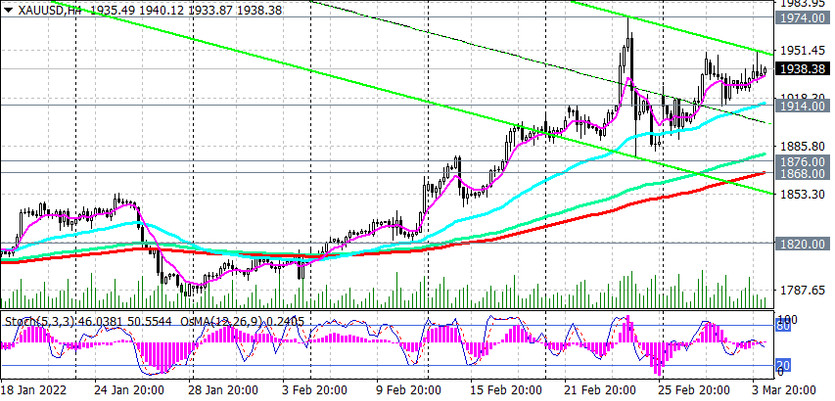
In an alternative scenario, XAU/USD will return to the key long-term and psychologically important support level 1800.00.
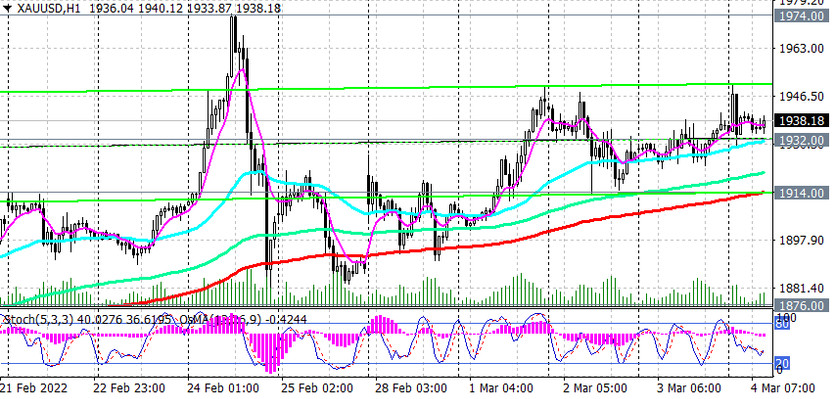
The first signal for the implementation of this scenario will be a breakdown of the short-term support level 1932.00 (EMA200 on the 15-minute chart), and a breakdown of the support level 1914.00 (EMA200 on the 1-hour chart) will strengthen the corrective downward dynamics, sending XAU/USD to the support levels 1876.00, 1868.00 ( EMA200 on the 4-hour chart). However, only a breakdown of the support levels 1713.00 (EMA144 on the weekly chart), 1648.00 (EMA200 on the weekly chart) will increase the risks of breaking the long-term bullish trend of XAU/USD.
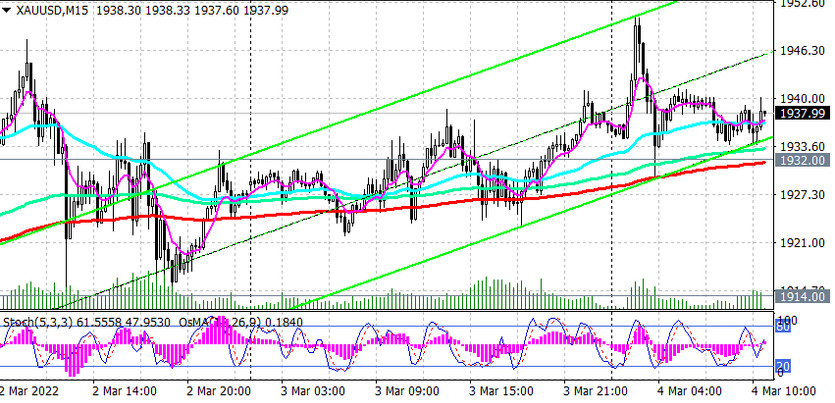
Support levels: 1932.00, 1914.00, 1876.00, 1868.00, 1820.00, 1800.00, 1713.00, 1700.00, 1648.00
Resistance levels: 1974.00, 2000.00, 2010.00, 2074.00
Trading recommendations
Sell Stop 1928.00. Stop Loss 1951.00. Take-Profit 1914.00, 1876.00, 1868.00, 1820.00, 1800.00, 1713.00, 1700.00, 1648.00
Buy Stop 1951.00. Stop Loss 1928.00. Take-Profit 1960.00, 1970.00, 1995.00, 2000.00, 2070.00


