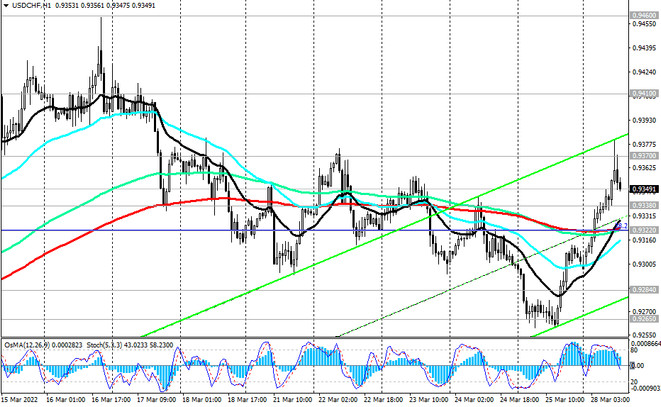
As of this writing, USD/CHF is traded near 0.9350 mark, down from an intraday high of 0.9380 hit during the Asian session.
Since the beginning of 2021 USD/CHF has been growing. Its uptrend is clearly visible on the weekly price chart, where USD/CHF remains within the rising channel. Its upper border is between 0.9460 (local maximum) and 0.9465 (resistance level in the form of a Fibonacci 50% of the upward correction to the downward wave that began in April 2019 near 1.0235).
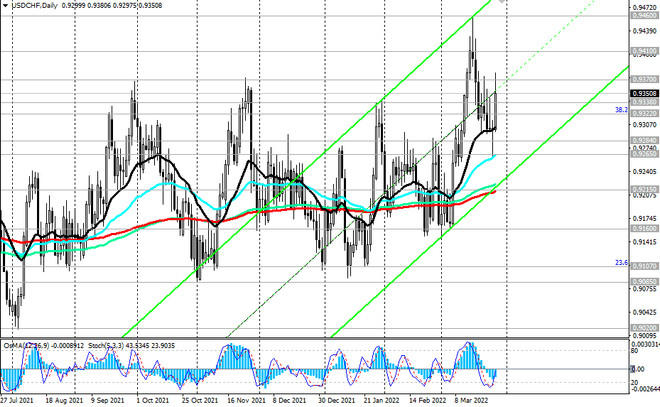
The pair maintains positive momentum, trading in the area above the important long-term support level 0.9215 (EMA200 on the daily chart, EMA50 on the weekly chart).
In case of a breakdown of the key resistance level 0.9410 (EMA200 on the weekly chart), USD/CHF will finally move into the bull market zone, and the marks 0.9460, 0.9495 will become the nearest growth targets for the pair.
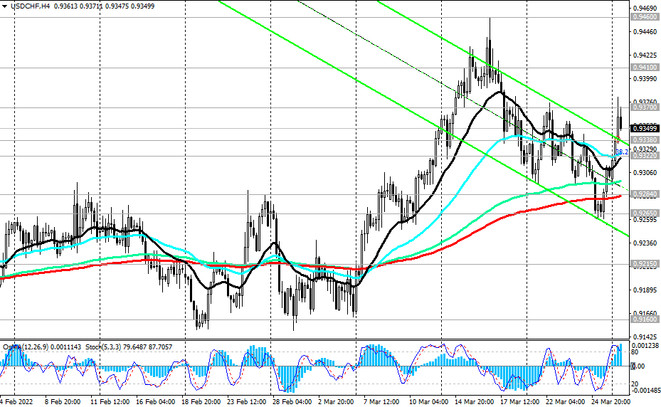
In an alternative scenario, the decline in USD/CHF will resume. The first sell signal will be a breakdown of the support level 0.9322 (EMA200 on the 1-hour chart and the Fibonacci level 38.2%). The targets of the downward correction will be the support levels 0.9284 (EMA200 on the 4-hour chart), 0.9265 (EMA50 on the daily chart).
However, the decline to the support level 0.9215 will still be considered a downward correction, but its breakdown may once again push USD/CHF into the bearish market.
In the current situation, the main scenario for further growth of USD/CHF is preferable.
Support levels: 0.9338, 0.9322, 0.9284, 0.9265, 0.9215, 0.9160, 0.9107, 0.9085
Resistance levels: 0.9370, 0.9410, 0.9460, 0.9495, 0.9670, 1.0000, 1.0235, 1.0480
Trading recommendations
Sell Stop 0.9315. Stop Loss 0.9375. Take-Profit 0.9300, 0.9284, 0.9265, 0.9215, 0.9160, 0.9107, 0.9085
Buy Stop 0.9375. Stop Loss 0.9315. Take-Profit 0.9410, 0.9460, 0.9495, 0.9670, 1.0000, 1.0235, 1.0480


