Last Monday, the USD/JPY pair hit a local almost 7-year high near 125.10. In total, USD/JPY has grown by more than 5% since the beginning of the year. The main reason is the prospect of further divergence between the monetary policy trajectories of the Fed and the Bank of Japan. The weakening of the yen is also facilitated by the events in Ukraine, where Russia is conducting a military special operation, and inflation accelerated in Japan against the backdrop of a sharp rise in energy prices (Japan is the largest net importer of them).
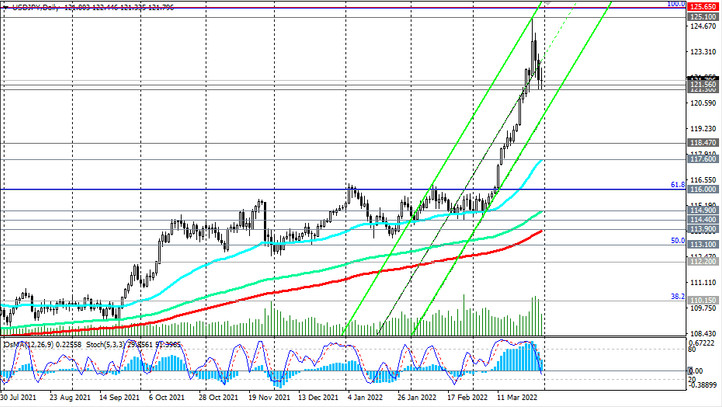
However, due to the sharp weakening of the dollar in the previous two days, the USD/JPY pair has declined, reaching by now an important short-term support level 121.56 (EMA200 on the 1-hour chart).
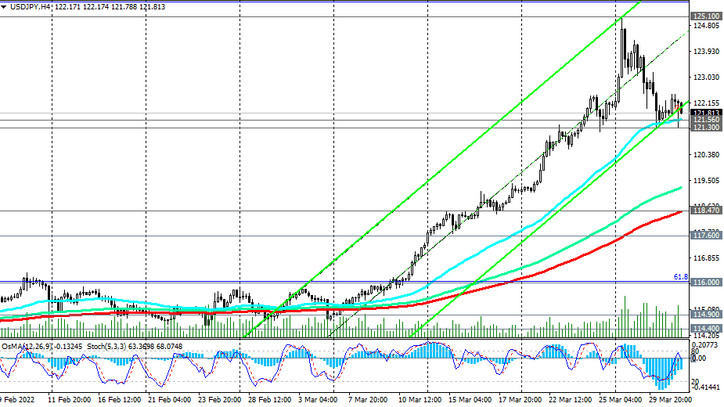
In case this support level is broken, the USD/JPY correctional decline may continue, but it will most likely be limited by the support levels 118.47 (EMA200 on the 4-hour chart), 117.60 (EMA50 on the daily chart).
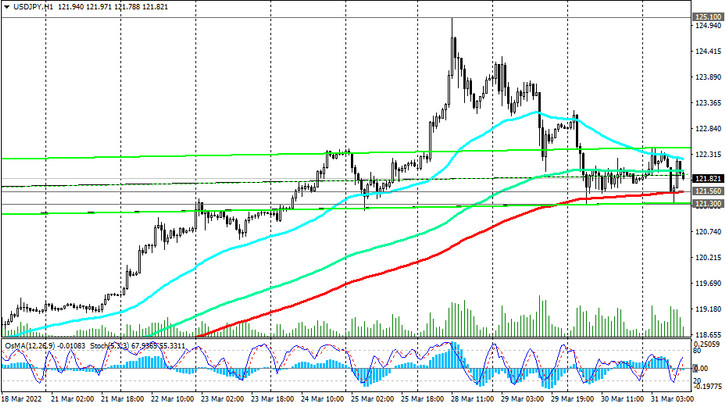
The ascending dynamics of USD/JPY prevails. Therefore, the most likely rebound from the support level 121.56 and the resumption of growth. A breakdown of the local resistance level 122.43 will be a signal to resume buys.
In an alternative scenario and after the breakdown of the local support level 121.30 USD/JPY will head towards support levels 118.47, 117.60. A deeper decline in the current situation is unlikely. Trading above the key support levels 113.90 (EMA200 on the daily chart), 110.15 (EMA200 on the weekly chart and Fibonacci 38.2% retracement to the pair's fall from the level of 125.65 that began in June 2015), USD/JPY remains in the bull market zone.
Support levels: 121.56, 121.30, 118.47, 117.60, 116.00, 114.90, 114.40, 113.90, 113.10, 112.20, 110.15
Resistance levels: 122.43, 123.00, 124.00, 125.00, 125.65
Trading scenarios
Buy Stop 122.50. Stop Loss 121.10. Take Profit 123.00, 124.00, 125.00, 125.65
Sell Stop 121.10. Stop Loss 122.50. Take-Profit 120.00, 119.00, 118.47, 118.00, 117.60, 117.00, 116.00, 114.90, 114.40, 113.90, 113.10, 112.20, 110.15


