AUD/USD continues to develop an upward momentum, while the AUD receives support from the growth of commodity prices, the growth of global stock indices and positive macro data coming from Australia.
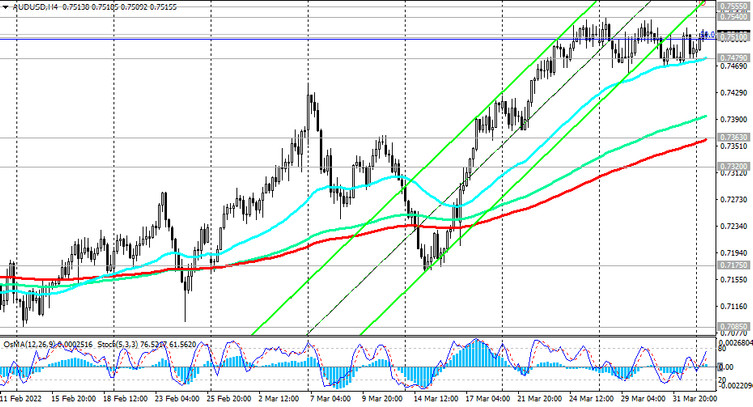
At the time of publication of this article, the pair is traded near 0.7516, above the important short-term support levels 0.7479 (EMA200 on the 1-hour chart), 0.7363 (EMA200 on the 4-hour chart), as well as above the key support level 0.7320 (EMA200, EMA50 on the daily and weekly charts).
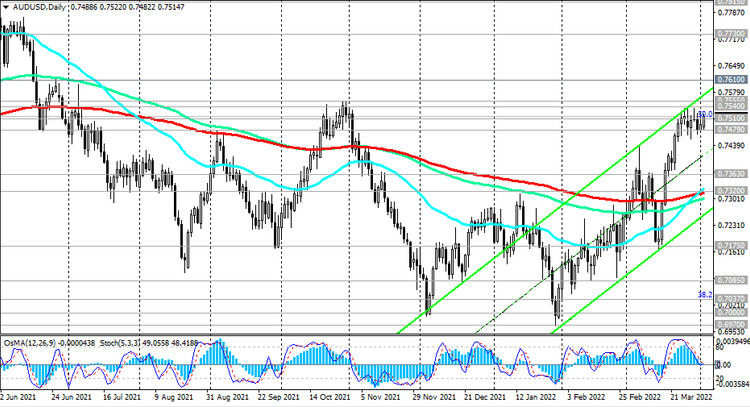
Last Friday, the 3rd month began, as AUD/USD maintains a positive trend, trading within an ascending channel on the daily chart.
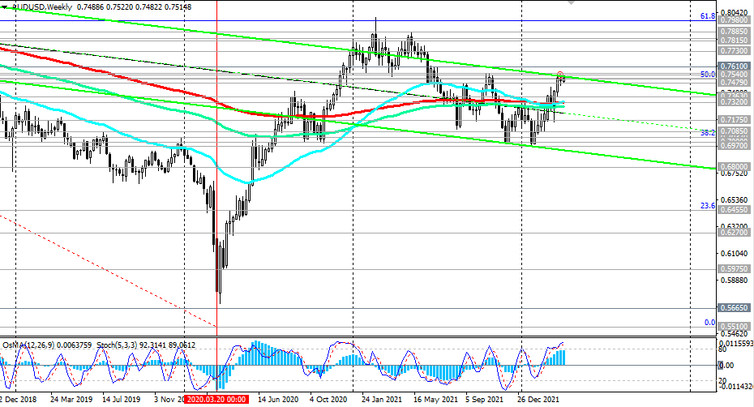
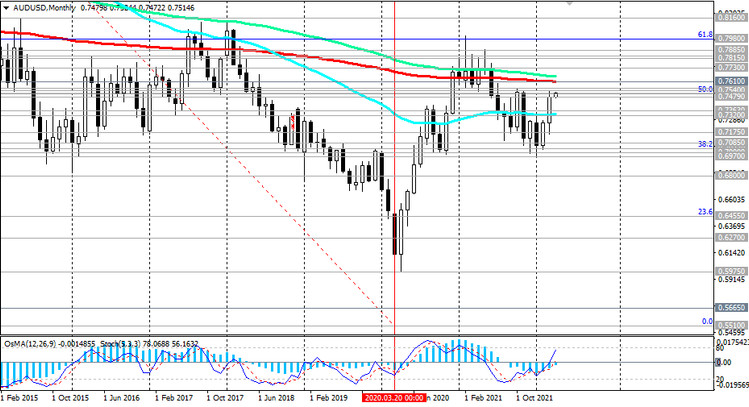
Breakdown of the resistance level 0.7540 (local maximum) will push the AUD/USD pair to further growth with the current target 0.7610 (EMA200 on the monthly chart). A breakdown of the resistance level 0.7610 and further growth may finally bring AUD/USD into the zone of a long-term bull market.
In an alternative scenario, we expect the AUD/USD to decline again. The first signal for this will be a breakdown of the short-term support level 0.7479. Nevertheless, the decline down to the support level 0.7320 will be considered corrective. In the current situation, long positions remain preferable.
Support levels: 0.7510, 0.7479, 0.7400, 0.7363, 0.7320, 0.7175, 0.7085, 0.7037, 0.7000, 0.6970
Resistance levels: 0.7540, 0.7555, 0.7610, 0.7730, 0.7775, 0.7815, 0.7900, 0.8000
Trading Recommendations
Sell Stop 0.7450. Stop Loss 0.7525. Take-Profit 0.7400, 0.7363, 0.7320, 0.7175, 0.7085, 0.7037, 0.7000, 0.6970
Buy Stop 0.7525. Stop Loss 0.7450. Take-Profit 0.7540, 0.7555, 0.7610, 0.7730, 0.7775, 0.7815, 0.7900, 0.8000