On the eve of the publication of the minutes of the Fed's March meeting, the USD/CAD pair is traded in a narrow range today, maintaining the potential for further decline.
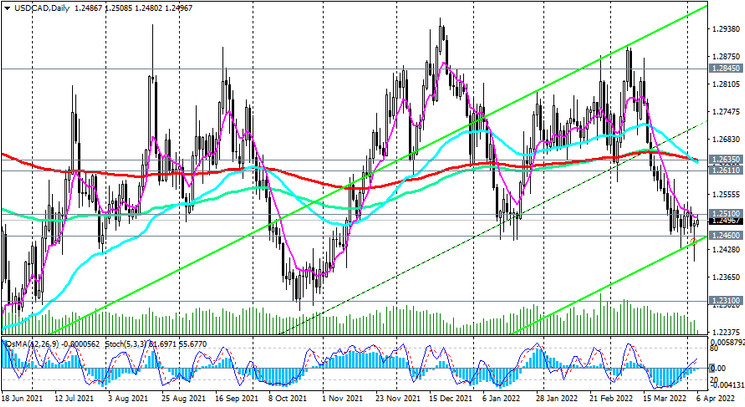
The pair remains in the bear market zone, trading below the key resistance levels 1.2365 (EMA200, EMA144, EMA50 on the daily chart), 0.2845 (EMA200, EMA144 on the weekly chart).
Downward dynamics prevails, making short positions preferable.
The breakdown of the support level 1.2460 (local lows and the lower line of the rising channel on the daily chart) will be a confirming signal for building up short positions.
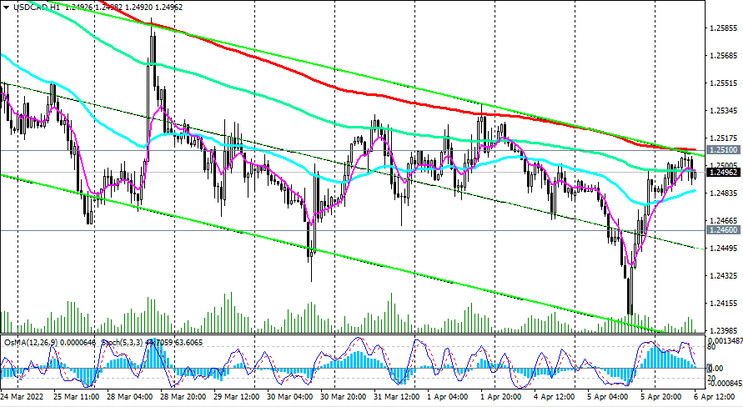
In an alternative scenario, the first signal for the resumption of long positions will be a breakdown of the resistance level 1.2510. This mark is crossed by an important short-term resistance level (EMA200 on the 1-hour chart) and a key long-term level in the form of a 200-period moving average on the monthly chart, which separates the long-term bull market from the bear market. However, in order to open long long-term positions, one should still wait for the USD/CAD to rise into the zone above the resistance level 1.2635. A breakdown of the resistance level 1.2845 will finally return USD/CAD to the territory of the long-term bull market.
Support levels: 1.2460, 1.2400, 1.2310, 1.2165, 1.2050
Resistance levels: 1.2510, 1.2611, 1.2635, 1.2700, 1.2800, 1.2845, 1.2900
Trading scenarios
Sell Stop 1.2470. Stop Loss 1.2520. Take-Profit 1.2460, 1.2400, 1.2310, 1.2165, 1.2050
Buy Stop 1.2520. Stop Loss 1.2470. Take-Profit 1.2600, 1.2635, 1.2700, 1.2800, 1.2845, 1.2900, 1.3000