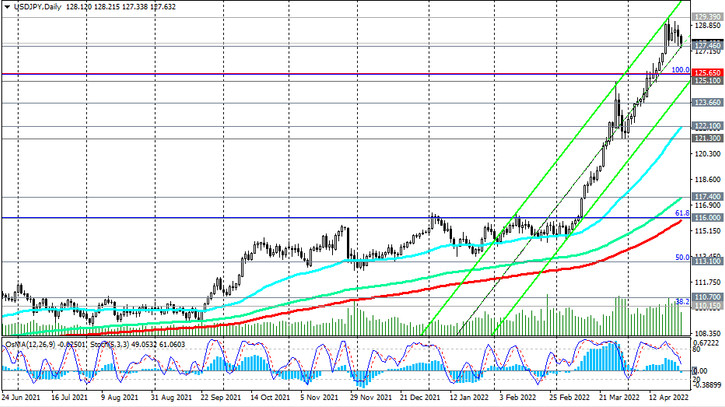
As we noted above, USD/JPY hit new multi-year highs near 129.40 last week. However, further growth of the pair has so far stalled. Nevertheless, it maintains a positive trend, including due to the accelerating divergence of the curves reflecting the direction of the monetary policies of the Fed and the Bank of Japan.
A break into the zone above the recent local highs near 129.40 will be a signal to increase long positions. Note that in January 2002 the pair was close to 135.00.
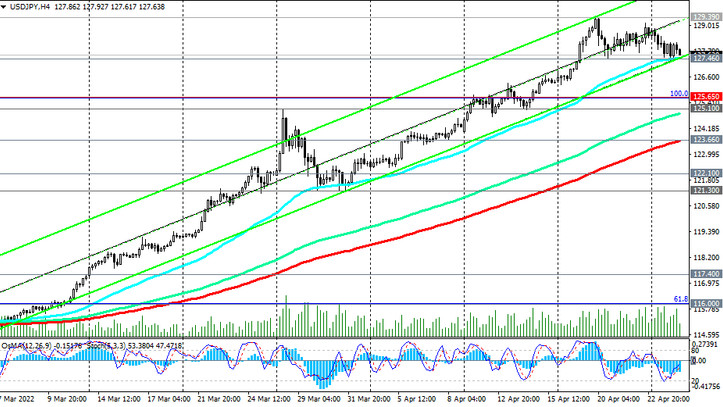
In an alternative scenario, and after the breakdown of the support level 127.46 (EMA200 on the 1-hour chart), USD/JPY will head towards the support levels 125.10 (local level), 123.66 (EMA200 on the 4-hour chart), which can only be considered as a corrective decline.
A deeper decline in the current situation is unlikely. Trading above the key support levels 116.00 (EMA200 on the daily chart and the Fibonacci 61.8% retracement of the pair's fall from the level 125.65 that began in June 2015), 110.70 (EMA200 on the weekly chart), USD/JPY remains in the bull market zone.
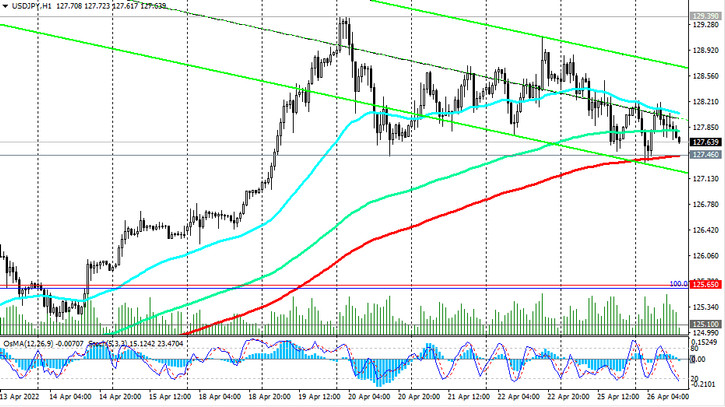
Support levels: 127.46, 125.65, 125.10, 123.66, 122.10, 121.30, 117.40, 116.00, 110.70
Resistance levels: 129.40
Trading scenarios
Buy Stop 128.30. Stop Loss 127.20. Take-Profit 129.00, 130.00, 131.00, 134.00, 135.00
Sell Stop 127.20. Stop Loss 128.30. Take-Profit 126.00, 125.65, 125.10, 123.66, 122.10, 121.30, 117.40, 116.00, 110.70