As the US Bureau of Labor Statistics reported yesterday, the consumer price index (CPI) in April rose by +0.3% (+8.3% in annual terms), exceeding the growth forecast by +0.2% and +8.1%, respectively. Although growth was better than expected, it still slowed down from +1.2% and +8.5%, respectively, in March.
The core consumer price index (Core CPI) rose by +0.6% (+6.2% in annual terms), which also turned out to be higher than expected, but lower than March values.
The slowdown in annual inflation in April was the first easing in price pressures since August 2021. The data suggests that the Fed's more aggressive policy has been effective, but inflation is still rising, albeit at a slower pace. Inflation still remains near 40-year highs, which will force the Fed to continue to pursue a more aggressive policy.
Last week, the Fed famously raised interest rates by 0.50%, its biggest hike since 2000, and approved a plan to cut its $9 trillion asset portfolio to curb inflation.
Uncertainty for investors is exacerbated by the military conflict in Ukraine, which has further fueled inflation by pushing up commodity prices, as well as coronavirus restrictions in China, which threaten to undermine the global economy.
Taking into account the total advantage of the dollar in the currency market and the fall in the global stock markets, we can assume a further increase in DXY. Exactly 20 years ago, DXY dollar index futures traded near 110.0. And so far, there are no important fundamental factors that could slow down the strengthening of the dollar and the growth of the DXY towards this mark (at the time of publication of this article, futures for the DXY dollar index are traded near 104.52).
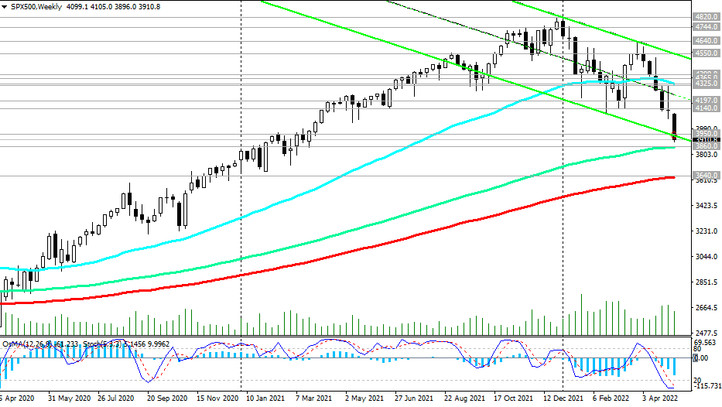
Meanwhile, the decline in the US stock market continues. Thus, at the time of publication of this article, S&P500 futures are traded near 3910.0. “A decline below 3640.0 may break the S&P500 bullish trend,” we suggested in our previous review for 05/09/2022, and so far everything is going according to this scenario.

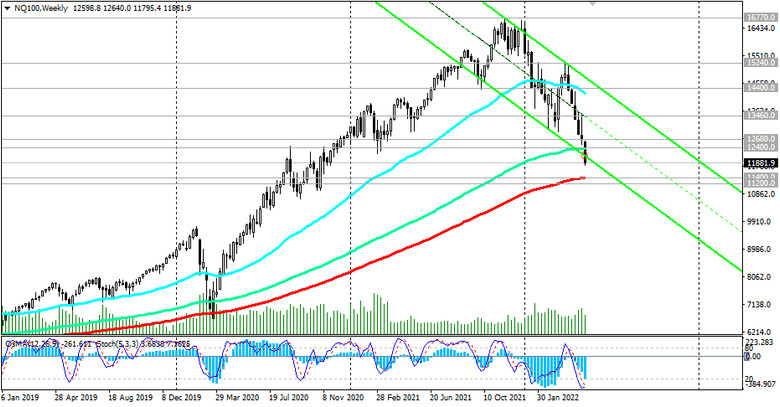
Another major US stock index Nasdaq100, which includes the 100 largest companies by capitalization, whose shares are traded on the NASDAQ exchange, except for companies in the financial sector, has also reached a critical support zone near the levels of 12400.0, 11400.0. A breakdown of the support level 11200.0 may significantly increase the risks of breaking the global bullish trend of the Nasdaq100 index (for more details, see "Technical analysis and trading recommendations").


