As we noted above, the Canadian dollar is strengthening, receiving support from rising oil prices and ahead of the meeting (on Wednesday) of the Bank of Canada, during which, as expected, the bank's management will decide to raise the interest rate.
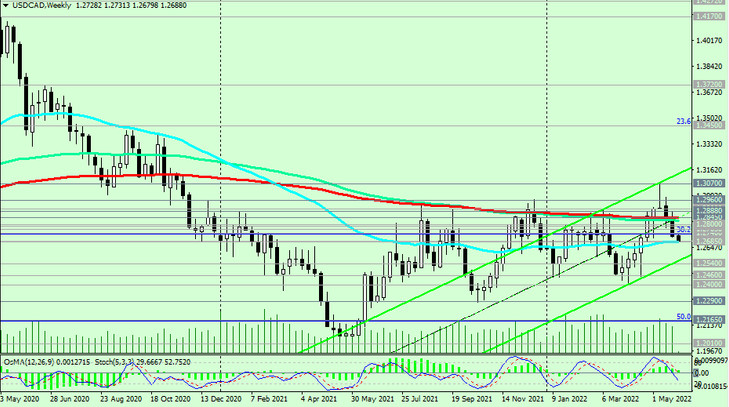
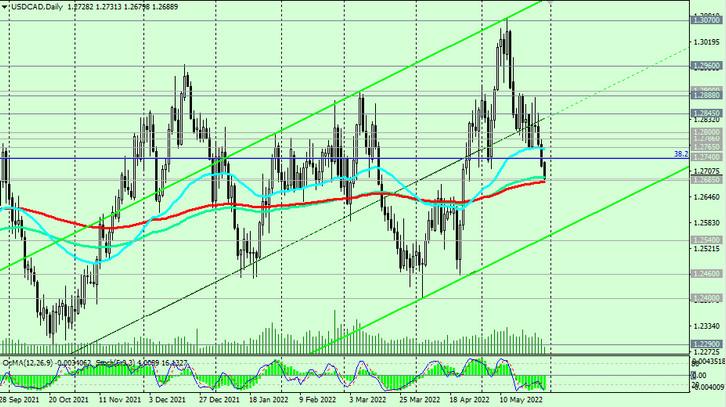
At the time of writing this article, USD/CAD is traded at a key support level 1.2685, down from the local high reached earlier this month (since December 2020) at 1.3076.

Last week the price has already broken through the key support level 1.2845 (EMA200 on the weekly chart). Breakdown of support level 1.2685 (EМА200 on the daily chart, ЕМА50 on the weekly chart) may increase the risks of further decline. Breakdown of the key long-term support level 1.2540 (ЕМА200 on the monthly chart) will finally bring USD/CAD into the zone of the long-term bear market.

In an alternative scenario, the signal for buying will be a breakdown of the resistance levels 1.2740 (Fibonacci 38.2% of the downward correction in the USD/CAD growth wave from 0.9700 to 1.4600), 1.2765 (EMA50 on the daily chart) with the prospect of growth towards the recent local multi-month high 1.3070.
Thus, a high level of volatility remains in the pair, providing a lot of trading opportunities.
Support levels: 1.2685, 1.2600, 1.2540, 1.2460, 1.2400, 1.2290, 1.2165, 1.2010, 1.2000
Resistance levels: 1.2740, 1.2765, 1.2788, 1.2800, 1.2845, 1.2888, 1.2900, 1.2960, 1.3000, 1.3070, 1.3100
Trading scenarios
Sell Stop 1.2670. Stop Loss 1.2750. Take-Profit 1.2600, 1.2540, 1.2460, 1.2400, 1.2290, 1.2165, 1.2010, 1.2000
Buy Stop 1.2750. Stop Loss 1.2670. Take-Profit 1.2765, 1.2788, 1.2800, 1.2845, 1.2888, 1.2900, 1.2960, 1.3000, 1.3070, 1.3100


