On the eve of the publication of the US Department of Labor report (at 12:30 GMT), let's pay attention to the dynamics of gold prices and the XAU/USD pair. Yesterday, it rose sharply against the backdrop of a weak dollar, making an attempt to enter the bull market zone. XAU/USD broke through the key resistance level 1855.00 (EMA200 on the daily chart) and stopped at the resistance level 1866.00 (EMA144 on the daily chart). Thus, before entering the "operational space" for further growth and return to the long-term bull market, the price needs to rise above the resistance level 1875.00 (EMA50 on the XAU/USD daily chart).
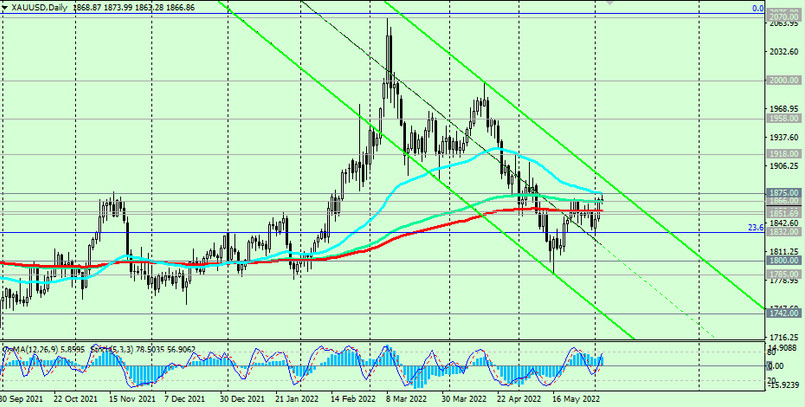
An alternative scenario will be associated with a breakdown of the support level 1832.00 (Fibonacci level 23.6% of the correction to the growth wave from December 2015 and the mark of 1050.00) and a retest of support levels 1800.00, 1785.00. Their breakdown will push XAU/USD to further decline towards the key support levels 1738.00, 1700.00. The breakdown of the long-term support level 1682.00 (EMA200 on the weekly chart and the Fibonacci level 38.2%) will finally break the long-term bullish trend of XAU/USD.
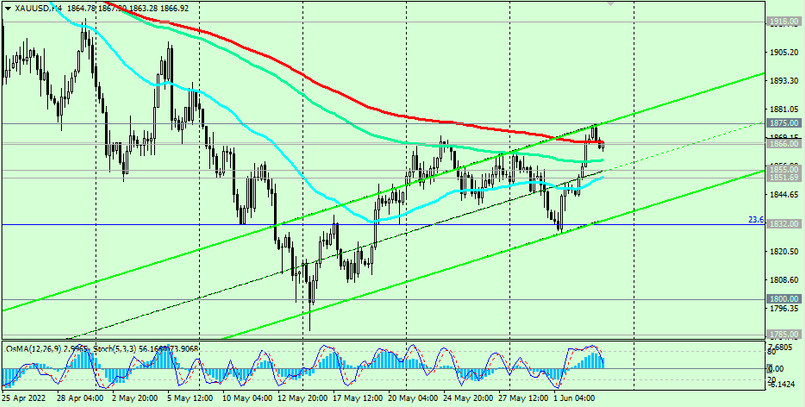
Support levels: 1855.00, 1851.00, 1832.00, 1800.00, 1785.00, 1742.00, 1700.00, 1682.00
Resistance levels: 1866.00, 1875.00, 1900.00, 1918.00, 1958.00, 2000.00, 2070.00, 2075.00
Trading recommendations
Sell Stop 1850.00. Stop Loss 1880.00. Take-Profit 1832.00, 1800.00, 1785.00, 1742.00, 1700.00, 1682.00
Buy Stop 1880.00. Stop Loss 1850.00. Take-Profit 1900.00, 1918.00, 1958.00, 2000.00, 2070.00, 2075.00