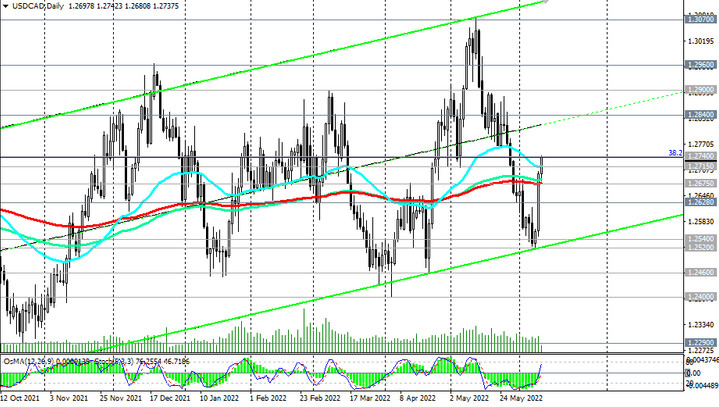
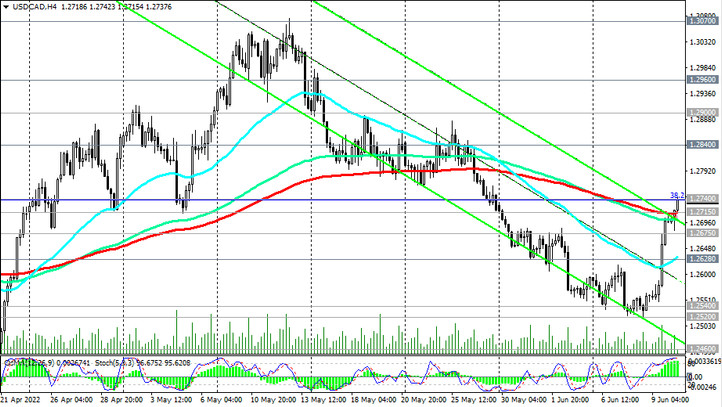
USD/CAD is trying to break through the zone of strong resistance levels 1.2675 (EMA200 on the daily chart, 1.2715 (EMA200 on the 4-hour chart, EMA50 on the daily chart), 1.2740 (Fibonacci 38.2% of the downward correction in the USD/CAD growth wave from the level of 0.9700 to the level of 1.4600). chart.

In an alternative scenario, a rebound and a decrease from the level of 1.2740 are possible with targets at support levels 1.2628 (EMA200 on the 1-hour chart), 1.2540 (EMA200 on the monthly chart), 1.2520 (local support level).

Support levels: 1.2715, 1.2675, 1.2628, 1.2600, 1.2540, 1.2520, 1.2460, 1.2400, 1.2290, 1.2165, 1.2010, 1.2000
Resistance levels: 1.2740, 1.2800, 1.2840, 1.2900, 1.2960, 1.3000, 1.3070, 1.3100
Trading recommendations
Sell Stop 1.2690. Stop Loss 1.2760. Take-Profit 1.2675, 1.2628, 1.2600, 1.2540, 1.2520, 1.2460, 1.2400, 1.2290, 1.2165, 1.2010, 1.2000
Buy Stop 1.2760. Stop Loss 1.2690. Take-Profit 1.2800, 1.2840, 1.2900, 1.2960, 1.3000, 1.3070, 1.3100


