At the time of writing this article, Nasdaq100 futures are traded near 11547.0, 187 pips above the local support level 11360.0 reached during the previous trading day.
A break through the resistance levels 11648.0 (EMA200 on the 1-hour chart), 12020.0 (EMA200 on the 4-hour chart) may provoke further corrective growth towards the resistance level 12290.0 (EMA144 on the 4-hour chart, EMA50 and the upper line of the descending channel on the daily chart).
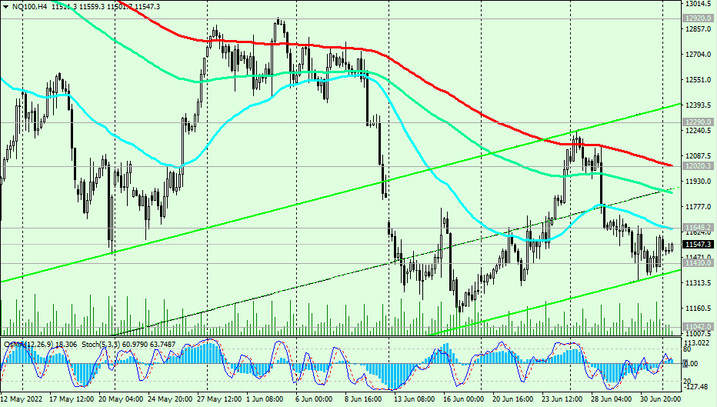
But so far, despite the current upward correction, in general, and below the key resistance level 13635.0 (EМА200 on the daily chart, ЕМА50 on the weekly chart), the negative dynamics of Nasdaq100 remains.
Therefore, near the current mark and the resistance level 11648.0, a rebound and a resumption of decline are possible.
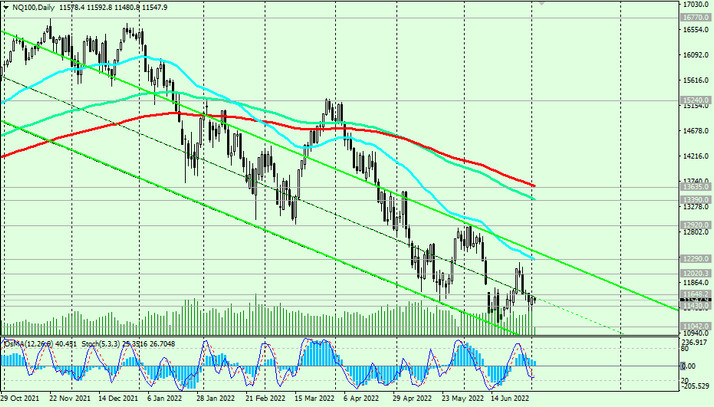
Breakdown of local support levels 11362.0, 11042.0 will be a signal to resume short positions and increase them.
In this case, the price will move into the zone of a long-term bearish market, and the key support levels 8100.00 (EMA144 on the monthly chart), 7300.00 (EMA200 on the monthly chart) will become the targets for the decline.
A breakdown of the key long-term support level 7300.00 may finally break the long-term global bullish trend of Nasdaq100, and, perhaps, of the entire American stock market.
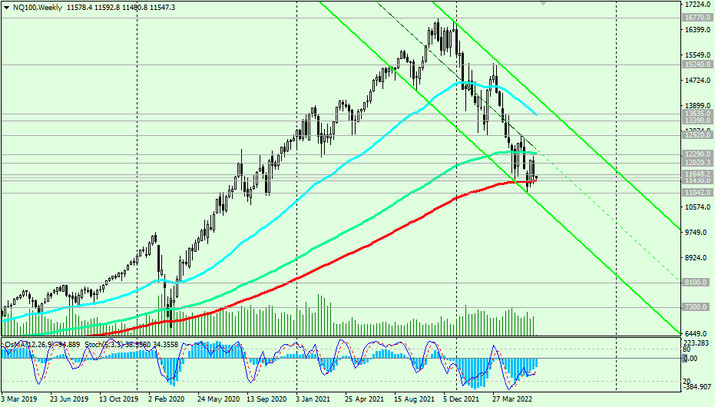
Support levels: 11042.0, 11362.0, 11430.0
Resistance levels: 11648.0, 12020.0, 12290.0, 12920.0, 13390.0, 13635.0
Trading recommendations
Sell Stop 11350.0. Stop Loss 11650.0. Targets 11042.0, 10000.0, 9000.0, 8000.0
Buy Stop 11650.0. Stop Loss 11350.0. Targets 12020.0, 12290.0, 12920.0, 13390.0, 13635.0, 15240.0, 16700.0


