As of this writing, EUR/USD is traded near 1.0292 mark, just above today's nearly 20-year low of 1.0280. The negative momentum is growing and the pair continues to decline towards parity of the euro with the dollar.
The main driver here is the Fed's monetary policy, the most stringent among the rest of the world's largest central banks. While the ECB is considering when to start raising interest rates, market participants expect the Fed to raise interest rates already to 3.5% or even 4.0% by the end of this year.
As New York Fed President Williams and Cleveland Fed President Loretta Mester said last week, "It's smart to go to 3.5% - 4.0% of the federal funds rate" this year and then to 3.5% - 4.0% next year.
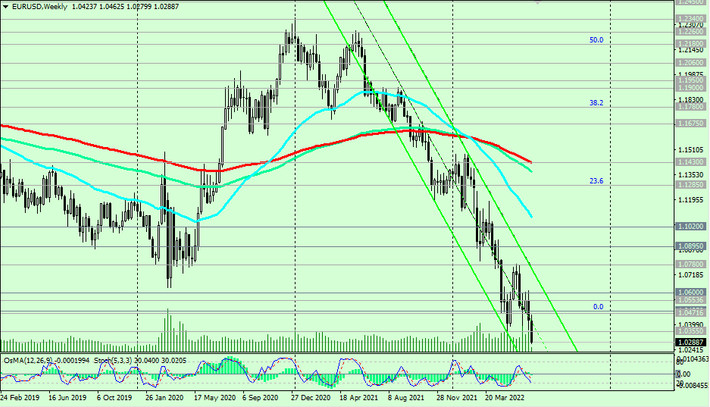
EUR/USD is falling deeper into the descending channel on the weekly chart and to its lower border, which is currently below 1.0200, and very soon, given the intraday volatility of EUR/USD in 75-100 points, this mark will be passed.
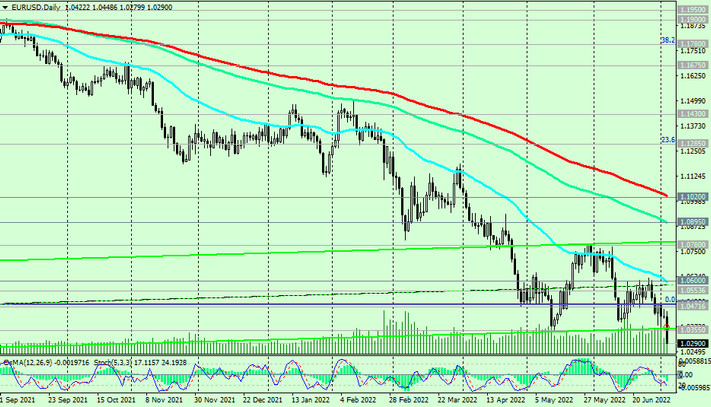
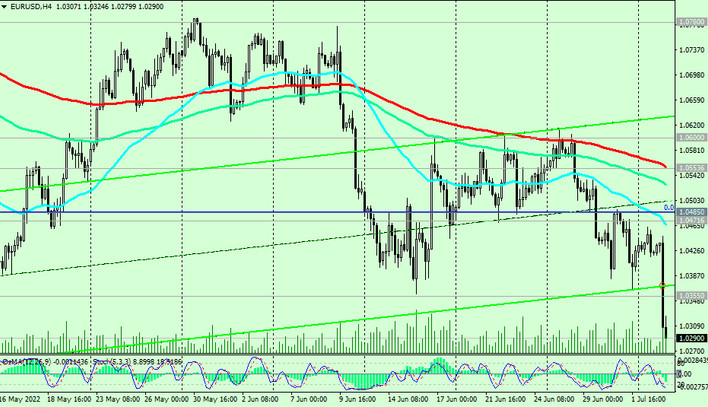
Below the key resistance levels 1.0895 (EMA144 on the daily chart), 1.1020 (EMA200 on the daily chart) EUR/USD is in the zone of a long-term bearish market, and a possible corrective growth will most likely be limited by the resistance level 1.0600 (EMA50 on the daily chart). In the main scenario, we expect further decline.
Support levels: 1.0200, 1.0100, 1.0000
Resistance levels: 1.0355, 1.0471, 1.0554, 1.0600, 1.0780, 1.0800, 1.0895, 1.1000, 1.1020
Trading Recommendations
Sell by market. Stop Loss 1.0360. Take Profit 1.0200, 1.0100, 1.0000
Buy Stop 1.0360. Stop Loss 1.0280. Take-Profit 1.0400, 1.0471, 1.0554, 1.0600, 1.0780, 1.0800, 1.0895, 1.1000, 1.1020