As we noted above, today at 12:30 (GMT) a significant increase in volatility is expected in the USD, CAD quotes and, accordingly, in the USD/CAD pair.
USD/CAD maintains positive momentum, remaining in the bull market zone, above the key support levels 1.2840 (EMA200 on the weekly chart), 1.2725 (EMA200 on the daily chart).
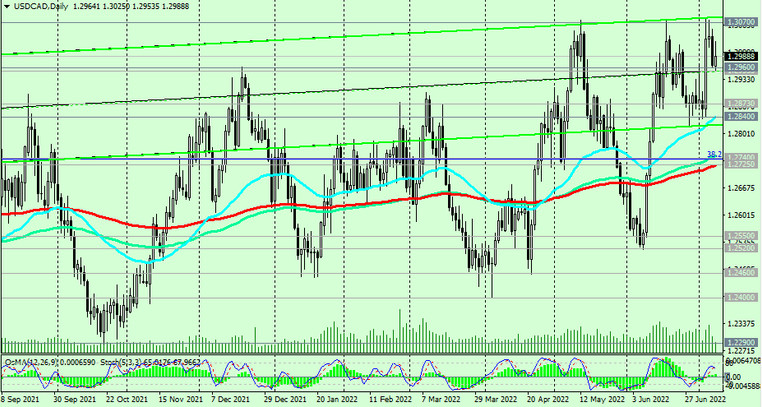
Breakdown of the local resistance levels 1.3000, 1.3070 will confirm the bullish market sentiment and send the pair towards the resistance level 1.3450 (Fibonacci level 23.6% of the downward correction in the USD/CAD growth wave from 0.9700 to 1.4600) with the prospect of further growth.
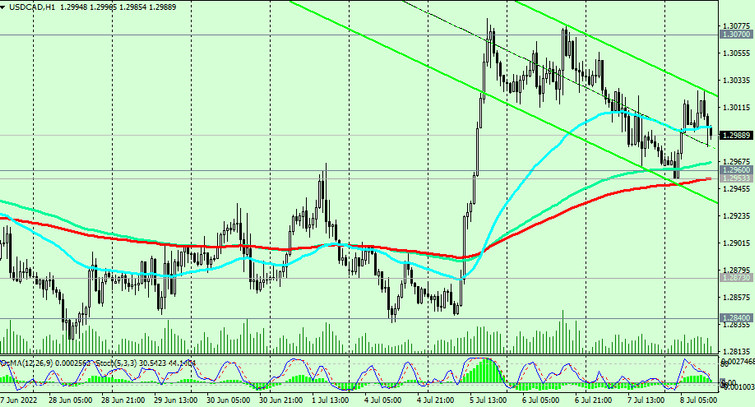
In an alternative scenario, USD/CAD will break through the support level 1.2953 (EMA200 on the 1-hour chart) and fall to the support level 1.2840. Its breakdown will be the first signal that USD/CAD will return to the zone of a long-term bear market.
A breakdown of support levels 1.2540 (EMA200 on the monthly chart), 1.2520 (local support level) will increase the risks of a further decline in USD/CAD and a resumption of the global downtrend.
Support levels: 1.2960, 1.2953, 1.2873, 1.2840, 1.2740, 1.2725, 1.2550, 1.2520
Resistance levels: 1.3000, 1.3070, 1.3100
Trading scenarios
Sell Stop 1.2950. Stop Loss 1.3030. Take-Profit 1.2900, 1.2873, 1.2840, 1.2740, 1.2725, 1.2550, 1.2520
Buy Stop 1.3030. Stop Loss 1.2950. Take Profit 1.3070, 1.3100, 1.3200