

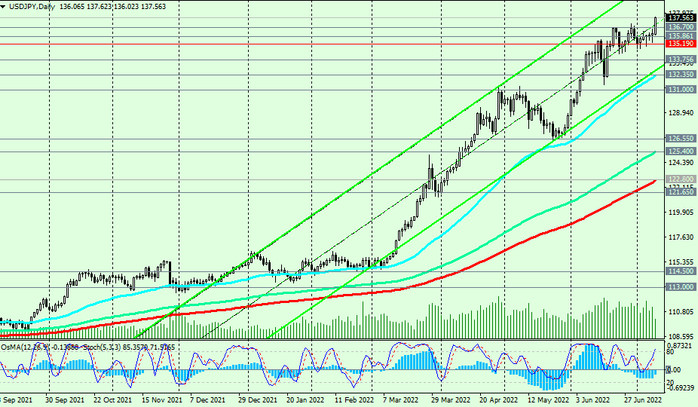
During today's Asian trading session, the USD/JPY pair broke through another psychologically significant level 137.00, reaching an intraday local maximum at around 137.27. The last time USD/JPY was close to current levels was in October 1998. The pair's quotes are growing both against the backdrop of a total strengthening of the dollar, and against the backdrop of the remaining weak yen. Economists also believe that the widening yield spread of US and Japanese government bonds contributes to the further growth of USD/JPY. Strategic Japanese investors are more willing to buy US government bonds, which bring more income than Japanese government bonds. Well, since the purchase of US assets is made in dollars, the purchase of the dollar for the yen contributes to the natural strengthening of the dollar against the yen. Markets are keeping a close eye on US Treasury yields and unless the BOJ's yield curve control (YCC) policy is changed in the near future, the USD/JPY outlook is likely to depend on the US yield outlook. If it (yield) grows, then USD/JPY will continue to grow.
At the same time, the yen remains extremely vulnerable as long as the Bank of Japan continues to take a wait-and-see attitude.
Masayoshi Amamiya, deputy central bank governor, said late last month that the Bank of Japan will maintain an easing monetary policy to support the economy. The head of the Bank of Japan, Haruhiko Kuroda, as part of a discussion held in Basel on June 26, also noted that "unlike other economies, the Japanese economy has not been hit hard by the global inflationary trend, so monetary policy will continue to be stimulating."
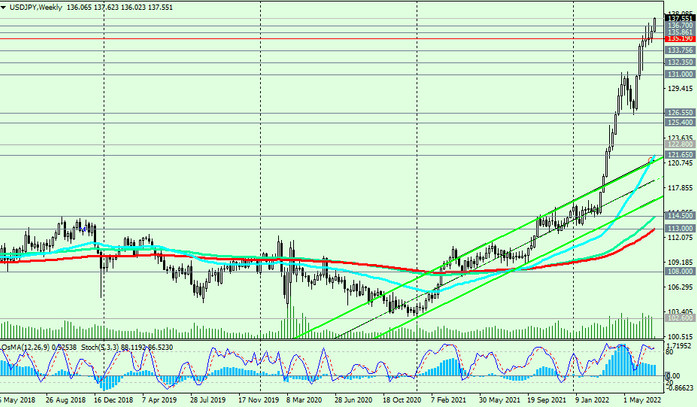
USD/JPY is currently traded near 137.57, with potential for further gains. The best option would be to wait for a rollback, at least, to the support levels of 136.00, 135.86, 135.19, 135.00. Nevertheless, given the strong upward momentum, fueled, among other things, by the growing divergence in the direction of the monetary policies of the Fed and the Bank of Japan, purchases from current levels also look logical.
Support levels: 137.00, 136.80, 136.00, 135.86, 135.19, 135.00, 133.75, 132.35, 131.00, 126.55, 125.40, 122.80
Resistance levels: 138.00, 139.00, 140.00
Trading scenarios
Buy by-market. Stop Loss 135.80.
Buy Limit 136.00, 135.86, 135.19, 135.00. Stop Loss 132.00.
Take Profit 138.00, 139.00, 140.00
Sell Stop 135.80. Stop Loss 137.30. Take-Profit 135.19, 135.00, 133.75, 132.30


