Despite the expected next increase in interest rates at tomorrow's RBNZ meeting, NZD/USD is under pressure from the total strengthening of the US dollar.
In general, the downward dynamics of NZD/USD prevails, and after the breakdown of the local support level 0.6105, the price is likely to move further “south”, towards the marks of 0.5700, 0.5800, and it is possible that lower, to the area of the mark 0.5500, where the price was in March 2020.
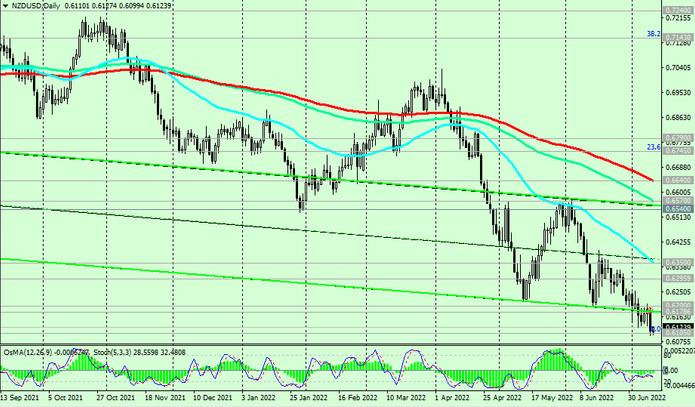
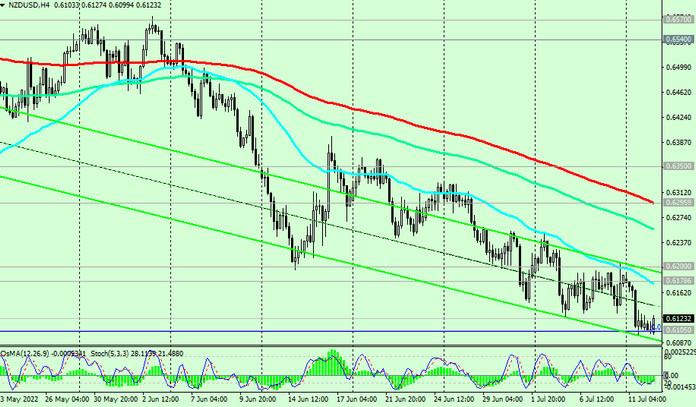
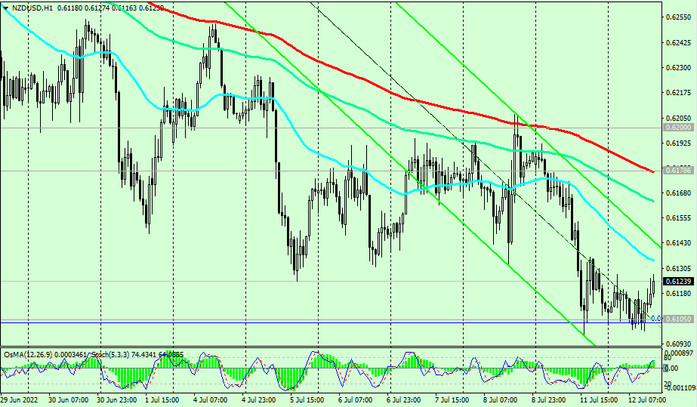
In an alternative scenario, NZD/USD will head towards 0.6350, through which the resistance level in the form of EMA50 on the daily chart passes, and the signal to start this upward correction will be a breakdown of resistance levels 0.6179 (EMA200 on the 1-hour chart), 0.6200 with an intermediate target at resistance level 0.6295 (EMA200 on the 4-hour chart).
In general, the downward dynamics of NZD/USD prevails, which makes short positions preferable.
Support levels: 0.6105, 0.6100, 0.6075, 0.6000, 0.5910, 0.5850, 0.5800, 0.5700, 0.5670
Resistance levels: 0.6179, 0.6200, 0.6295, 0.6300, 0.6350, 0.6400, 0.6500, 0.6540, 0.6570, 0.6640, 0.6745, 0.6790
Trading recommendations
Sell Stop 0.6090. Stop Loss 0.6140. Take-Profit 0.6075, 0.6000, 0.5910, 0.5850, 0.5800, 0.5700, 0.5670
Buy Stop 0.6140. Stop Loss 0.6090. Take-Profit 0.6179, 0.6200, 0.6295, 0.6300, 0.6350, 0.6400, 0.6500, 0.6540, 0.6570, 0.6640, 0.6745, 0.6790