As you can see from the chart of the DXY dollar index, it is falling today for the 3rd day in a row, after reaching a new local high above 109.00 last week.
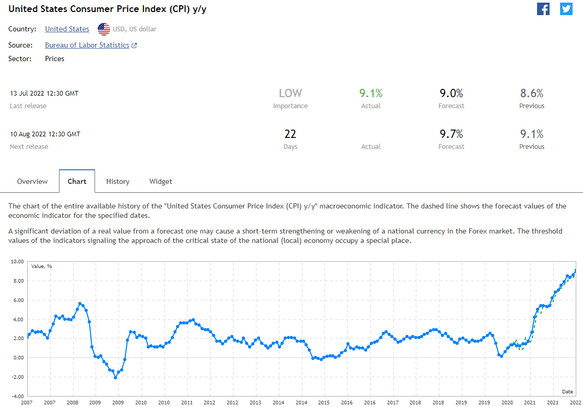
Market participants continue to evaluate the inflation indicators published last week, which pointed to the continuing rise in inflation in the US. As follows from the data of the US Bureau of Labor Statistics, published last Wednesday, in June, inflation in the US accelerated from 1.0% to 1.3%, and in annual terms jumped to the highest level in the last 40 years, amounting to 9.1%. (YoY) vs. 8.6% in May and market expectations of 8.8%.
Despite the current decline, the dollar continues to dominate the market, and given the strong bullish momentum and the long-term uptrend in DXY, the confirmed breakdown of the local resistance level 109.00 will be a signal to increase long positions in DXY futures "with the prospect of growth towards multi-year highs of 121.29 and 129.05, achieved in June 2001 and November 1985 respectively”.
Such a sharp increase in inflation strengthened the expectations of market participants regarding a more rapid tightening of the monetary policy of the American central bank, and this is so far the main driver of USD growth.
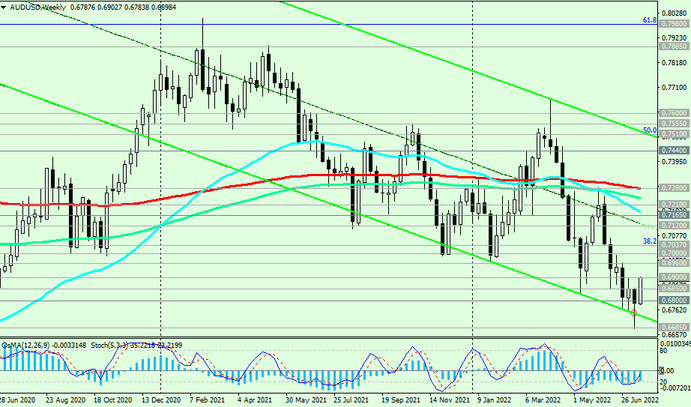
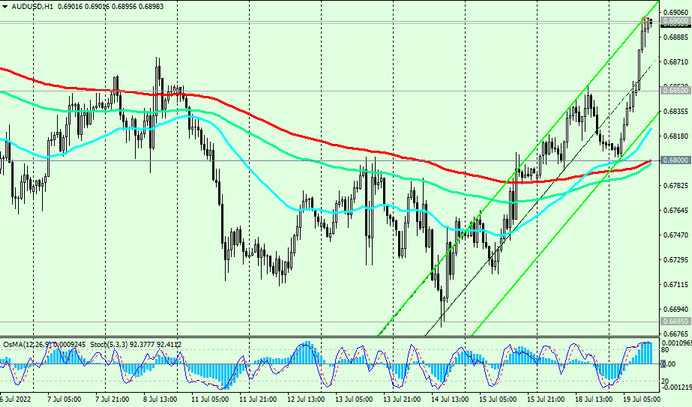
As for the AUD/USD, so far the pair's dynamics is dominated by negative momentum, which pushed it to a new 25-month low 0.6685 last week.
Therefore, the current growth of AUD/USD should be considered as corrective after the strongest fall since April of this year.
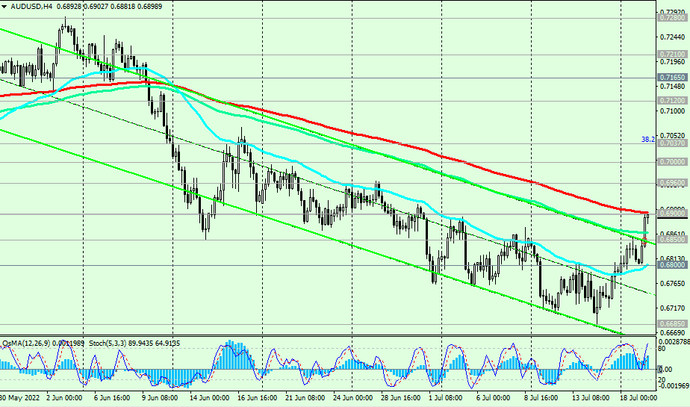
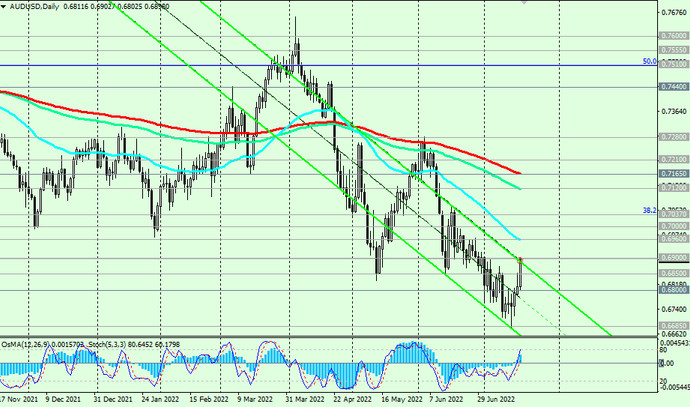
The most logical thing seems to be a rebound from the resistance level 0.6900 (EMA200 on the 4-hour chart) and AUD/USD return to the downtrend. A signal for new short positions will also be a breakdown of the local support level 0.6850, and a confirming one – a breakdown of the support level 0.6800 (EMA200 on the 1-hour chart).
The nearest targets for the decline are the support levels 0.6685 (local long-term and intra-month low), 0.6660 (lower line of the descending channel on the daily chart).
Support levels: 0.6850, 0.6800, 0.6700, 0.6685, 0.6660, 0.6500, 0.6455, 0.6270, 0.5975, 0.5665, 0.5510
Resistance levels: 0.6900, 0.6960, 0.7000, 0.7037, 0.7100, 0.7120, 0.7165, 0.7210, 0.7280
Trading Recommendations
Sell 0.6900, Sell Stop 0.6840. Stop Loss 0.6920. Take-Profit 0.6800, 0.6700, 0.6685, 0.6660, 0.6500, 0.6455, 0.6270, 0.5975, 0.5665, 0.5510
Buy Stop 0.6920. Stop Loss 0.6840. Take-Profit 0.6960, 0.7000, 0.7037, 0.7100, 0.7120, 0.7165, 0.7210, 0.7280