

For the 4th month in a row, NZD/USD has been trading in the bear market zone, remaining below the key resistance levels 0.6790 (EMA200 on the weekly chart), 0.6745 (EMA200 on the monthly chart and the Fibonacci 23.6% correction level in the global wave of the pair's decline from the level 0.8820 in 2014-2015), 0.6610 (EMA200 on the daily chart). The pair hit "a new 26-month low at 0.6060" last week as investor sentiment intensified in the commodities market over the risks of a recession in the global economy.
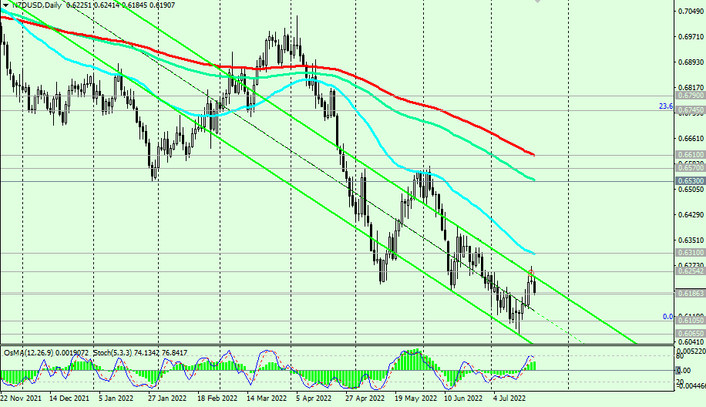
NZD/USD is under pressure from the total strengthening of the US dollar. In general, the downward dynamics of NZD/USD prevails, and after the breakdown of the local support level 0.6060, the price is likely to move further “south”, towards the 0.5700, 0.5800 marks, and it is possible that lower, to the area of the 0.5500 mark, where the price was in March 2020.
A break of the support level 0.6186 (EMA200 on the 1-hour chart) will be the first signal to increase/renew short positions.
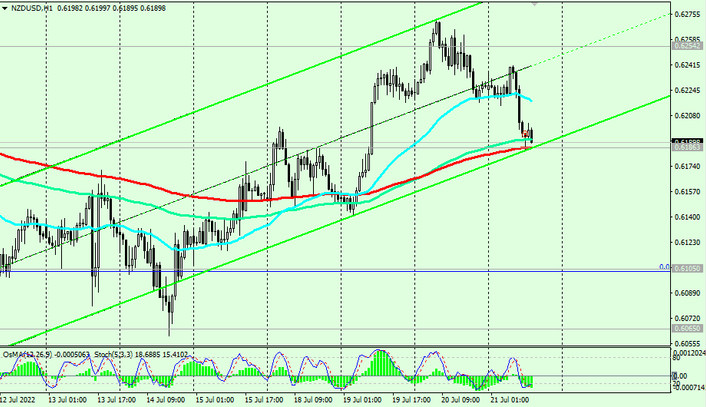
Support levels: 0.6186, 0.6105, 0.6100, 0.6065, 0.6000, 0.5910, 0.5850, 0.5800, 0.5700, 0.5670
Resistance levels: 0.6250, 0.6254, 0.6310, 0.6500, 0.6530, 0.6570, 0.6610, 0.6745, 0.6790
Trading recommendations
Sell Stop 0.6180. Stop Loss 0.6245. Take-Profit 0.6105, 0.6100, 0.6065, 0.6000, 0.5910, 0.5850, 0.5800, 0.5700, 0.5670
Buy Stop 0.6245. Stop Loss 0.6180. Take-Profit 0.6250, 0.6254, 0.6310, 0.6400, 0.6500, 0.6530, 0.6570, 0.6610, 0.6745, 0.6790


