Having finished last week in the negative zone, the new week also seems to start on a strong negative note for the US stock market: today's trading day started with a gap down for futures on major US stock indices. Thus, the S&P 500 broad market index last week reached a local 4-month high of 4327.0, and today it dropped sharply and is testing an important support level 4186.0 (EMA200 on the daily chart, EMA50 on the weekly chart).
A breakdown of the support level 4155.0 (EMA144 on the daily chart) will mark the return of the price to the downward channel on the weekly chart and the resumption of the downward trend.
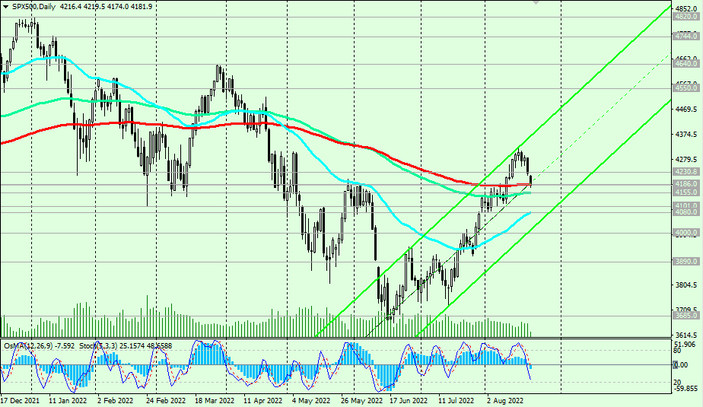
In this case, the S&P 500 will again head to the key long-term support level 3685.0 (EMA200 on the weekly chart), which separates the multi-year bullish trend from the bearish one. Its breakdown could finally break the long-term global bullish trend of the S&P 500.
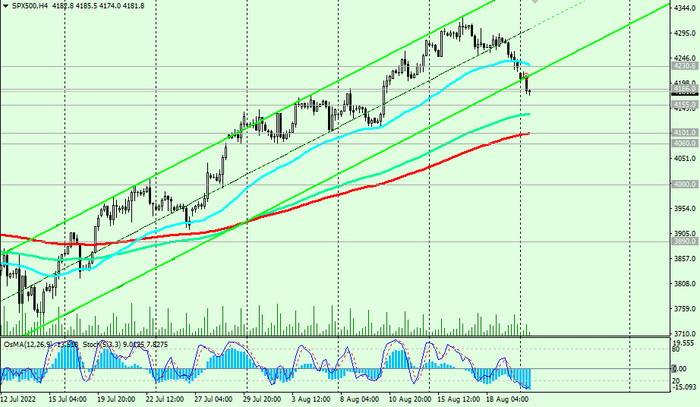
In an alternative scenario, and after the breakdown of the local resistance level 4327.0, the growth of the S&P 500 will continue towards a record high above 4800.00, reached at the very beginning of this year. The first signal for the implementation of this scenario will be a breakdown of the short-term resistance level 4230.0 (EMA200 on the 1-hour chart).
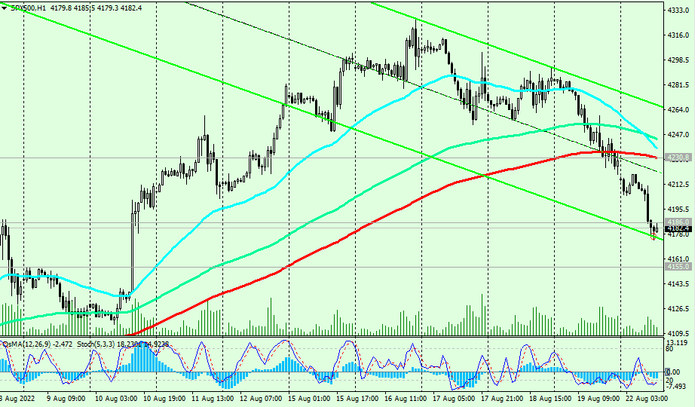
Support levels: 4186.00, 4155.00, 4101.00, 4080.00, 3890.00, 3685.00
Resistance levels: 4230.00, 4300.00, 4327.00, 4400.00, 4550.00, 4640.00, 4820.00
Trading recommendations
Sell Stop 4150.0. Stop Loss 4220.0. Targets 4101.0, 4080.0, 3890.0, 3685.0
Buy Stop 4220.0. Stop Loss 4150.0. Targets 4300.0, 4327.0, 4400.0, 4550.0, 4640.0, 4820.0


