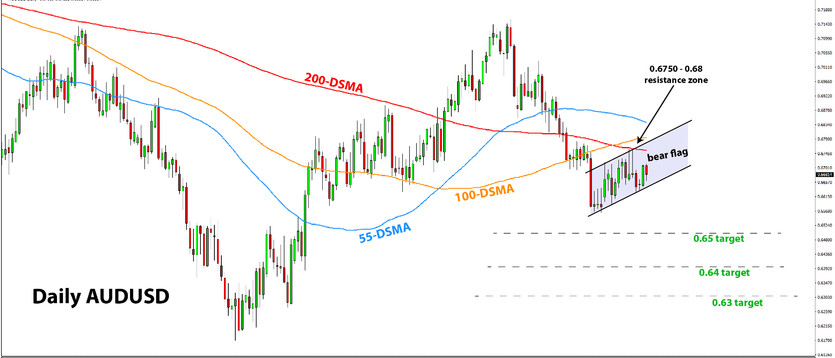
AUDUSD peaked in early February and then fell steadily until early March, when it started to consolidate. The pair is still in this consolidation range, which has the formation of a bear flag pattern. A bearish breakout of this flag pattern should open the potential for a further downside continuation of the AUDUSD pair. We could easily see AUDUSD testing the prior low at 0.6560 and then the 0.65 round number zone.
Banking crisis so far has limited impact on risk sentiment and the Aussie
As we can see on the AUDUSD chart below, the pair is stuck in a range while the banking crisis was unfolding in the US and Europe over the past 2-3 weeks. There was a big drop in AUDUSD on March 7 (tall red candle), but that was before the worst of the Silicon Valley Bank (SVB) unfolded.
It is also true that the impact on global risk sentiment is very limited so far. Central banks and Government authorities reacted quickly and managed the SVB and Credit Suisse collapses without allowing contagion to spread to other troubled banks so far. Risk sentiment remains supported across all markets, with stocks near unchanged levels as well as risk-sensitive currencies like AUD and NZD.
Nonetheless, the situation remains fragile. Whenever a bank fails, markets remain on edge. This sense of cautiousness will linger among traders and investors. Consequently, any further worsening of the situation for banks, could quickly develop in a larger risk aversion sell-off. Currencies like the Aussie will be vulnerable in such a situation. Hence a bearish break in AUDUSD would be the likely outcome.
Bear flag pattern indicates AUDUSD bias is still down
The top side of the flag pattern is currently located between the 100-day (orange) and 200-day (red) moving average at the 0.6750 - 0.6800 zone. This should be a solid resistance area, aided by the prior lows here. AUDUSD was already rejected here last week. Another move toward this zone should still be met with strong bearish pressures and resistance likely to hold. This could be a potentially attractive zone to enter short too.
Nonetheless, the bear flag pattern will only be triggered on a breakout below the lower line, currently located around 0.6630. A daily close below this zone would send the breakout signal. AUDUSD is then likely to continue the downtrend, and we can use the 0.65, 0.64, and 0.63 zones as TP targets on short trades.
Trade Plan
Entry:
- Scenario 1: Look to sell AUDUSD on bearish signals toward the 0.68 resistance zone. This can allow us to place a tight stop (see below).
- Scenario 2: Wait for a bearish break of the flag pattern.
Stop loss:
- Scenario 1: Place stop 20-30 pips above the high of the bearish entry pattern (above the 0.68 zone)
- Scenario 2:
Targets:
- TP 1 - 0.65
- TP 2 - 0.64
- TP 3 - 0.63


