Are you looking for somewhere to invest your money?
Investing in Forex trading is one of the interesting options that can give you a good return on your hard earned capital (considering a proper trading strategy and risk management is applied).
Before we discuss more about Forex trading, let us first define what Forex trading is.
Forex trading is the act of selling one currency and exchanging it (buying) for another. In the realm of trading, currency values rise and fall against one another due to certain factors like economics, geopolitics or market sentiment (supply and demand).
In Forex trading, traders have a common goal making a profit from the rise and fall in exchange rates by actively speculating on which way the Forex prices will go in the future.
Now that Forex trading is defined, you can see how complex it can be.
Even if you know that you are good at trading and making speculative trades, it does not mean that your trades will always be correct. Because of this, Forex traders are using advanced strategies, tools, and analytical methods that are designed to work in their advantage.
When it comes to tools, many traders are using the On Balance Volume Indicator or simply OBV.
The On Balance Volume Indicator
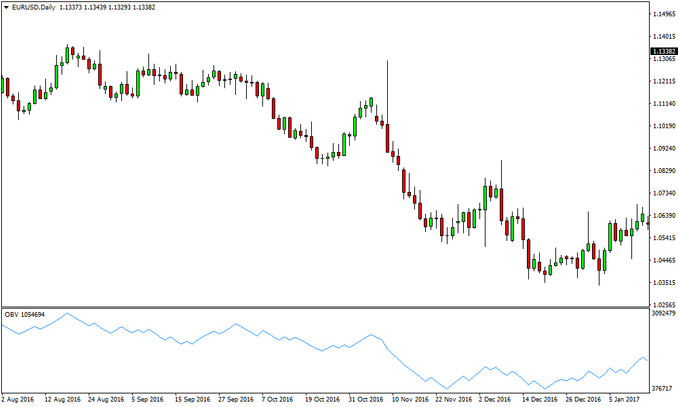
This is a technical indicator that acts as a confirmation tool for market trends. For instance, when the OBV and the price are moving in the same direction, it is a clear indication that a price trend is developing.
For beginning Forex traders, using the OBV can be confusing at first as it requires an understanding of how the indicator works and how it can be used in aiding trading decisions.
Let us start with the application of the On Balance Volume Indicator.
The On Balance Volume indicator tries to capture the behavior of retail and institutional traders. This is done by comparing the price changes to the volume for a given trading period. Often, a spike in volume is not followed by a spike in prices and this is usually a sign of larger - institutional investors quietly building their positions before the big move in the market happens.
Retail traders in the meantime are caught in the wrong direction, have their Stop-Losses taken out and then the price moves without them.

The OBV Indicator on a Euro-Dollar Daily chart
How to use the OBV Indicator?
Aside from using the OBV alone, a moving average can be added to the On Balance Volume line. A crossover signal can then be used to confirm trend changes and take trades and achieve an even greater accuracy with the indicator.
As you apply OBV on your Forex trading strategy, you should keep in mind the following rules:
- If the line of the OBV indicator rises together with the price, it is a confirmation sign of an ascending trend.
- If the indicator line declines accompanied by a drop in prices, it only confirms a downtrend.
- If the OBV line and the price start to diverge and even go into opposite directions, then the divergence is a sign that a change in trend is likely to occur soon.
- The indicator tends to work better on larger time frames like the hourly, 4 hour, daily, weekly and monthly charts.
Calculation Formula of the OBV indicator
Finally, before you go ahead and apply the OBV indicator on your charts, it’s good to know its calculation formula. The calculation for the OBV values goes as follows:
- If today’s close is greater than yesterday’s close: OBV(C) = OBV(C-1) + Volume(C)
- While, if today’s close is lower than yesterday’s close: OBV(C) = OBV(C-1) + Volume(C)
- And if today’s close was equal to yesterday’s close: OBV(C) = OBV(C-1)
The abbreviation OBV(C) is the indicator's value of the current period, OBV(C-1) is the indicator's value of the previous period and Volume(C) is the volume of the current bar.


