The Relative Strength Index is a technical indicator with which traders try to measure the current strength of a given asset, which makes it possible to greatly optimize the timing of entry and exit positions.
The strategy of crossing your RSI can be a sort of extension of all of this, where there is the additional assessment of whether short-term current strength is below/above the RSI based on a relatively longer time period, allowing for even a bit more fine-tuning of the extremely important entries and exits.
Strategy entry rules
Entering long positions
-faster RSI is above slower RSI
Entry into short positions
-faster RSI is below slower RSI
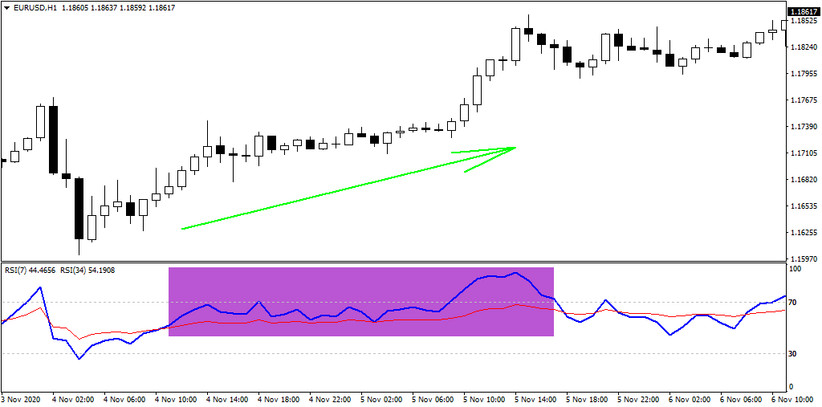
In the chart below, you can see a defined time session within which the faster RSI (blue) was above the slower RSI (red), making long entries possible.

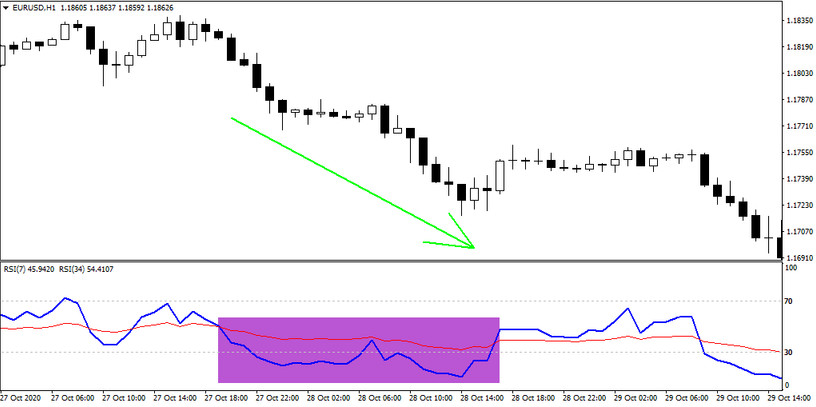
The next chart, on the other hand, highlights a situation where the RSI (blue) was below the slower RSI (red), which, unlike the first situation, provided an opportunity for shorts.

With the strategy of crossing two RSIs, it is possible to achieve success rates in the range of 60-75% on major currency pairs in the long term, which is more than sufficient for the long-term sustainability of the entire strategy.


