There are hundreds or even thousands of different strategies, systems or techniques that you can use when trading forex or any other market.
To become successful in trading the forex market, a good knowledge of candlestick patterns is useful as Price Action patterns are usually considered to be the most effective and accurate signals of the technical analysis.
Now we will examine the inside bar forex trading strategy.
What is Inside Bar?
Inside Bar is a candlestick pattern signaling low volatility period in a market. It means that there are not many orders coming to the market and that bulls as well as bears stay calm, and waiting for further market development.
It is very easy to spot the Inside Bar pattern in your charts. It is simply a candle where:
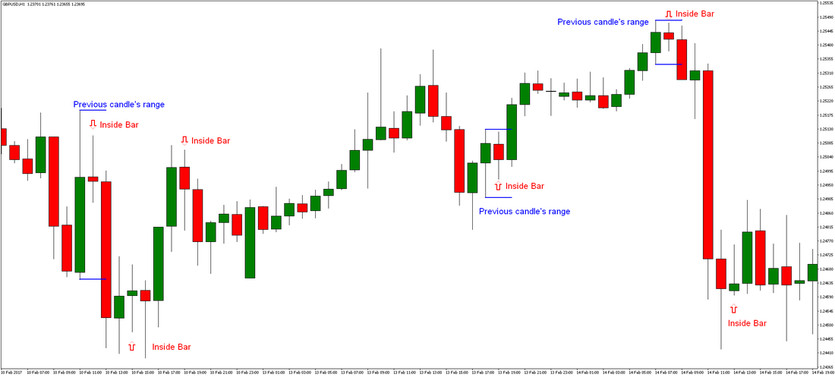
So the Inside Bar candle is simply located inside the range of the previous candle. In the picture below, you can see a few highlighted Inside Bars.
- The high of the Inside Bar pattern is lower than the high of the previous candle.
- And the low of the Inside Bar pattern is higher than the low of the previous candle.

What does the Inside Bar indicate?
As already mentioned, an inside bar usually indicates following:
- Consolidation : The market is taking a breather before moving on in the direction indicated by the breakout direction of the Inside Bar pattern.
- Indecision: The market does not make new highs or lows because market participants are unsure of the direction of further development.
How to trade using the Inside Bar Pattern?
As you maybe noticed when taking a look at the chart above, Inside Bars can also form other candlestick patterns in the same time.
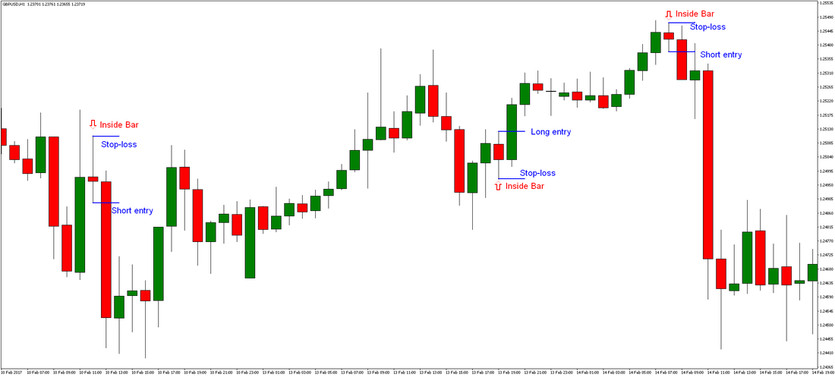
When aiming entirely on trading Inside Bars, an entry signal is generated as soon as a price breaks through a high or low of an Inside Bar pattern. The direction of the breakout determines the direction of the trade that should be opened. If a price breaks through the high of an Inside Bar, bullish signal is generated, and vice versa. It also means that Inside Bars can be traded by placing the stop pending orders.
Stop-Loss should be always placed on the other side of the candle. In case of the bullish breakout, the long order should be opened above the high of the Inside Bar, and the Stop-Loss should be placed below the low of the Inside Bar. Vice versa applies for bearish breakouts. You can see a few examples of trading Inside Bars below. The advantage here is that Inside Bars require small Stop-Loss only due to a low volatility period.

If you are trying to trade the Inside Bars, but your orders are stopped out too soon, you can also consider using the supports and resistances for placing Stop-Losses. Supports and resistances can be very effectively used for placing Profit-Targets as well.
Regarding the body of Inside Bars, it usually does not matter that much if it is bullish, bearish or neutral. However, if the breakout of an Inside Bar happens in the same direction as the direction of Inside Bar's body (like bullish breakout of the Inside Bar with bullish body), it can add some little extra points.
Inside Bar Trading System
It is important to say that neither Inside Bars are a surefire trading signal of technical analysis. However, by trading Inside Bars in a direction of the main trend or using Inside Bars in a conjunction with supports and resistances, you can significantly increase the probability of successful Inside Bar signals, and filter out fake breakouts in the same time.
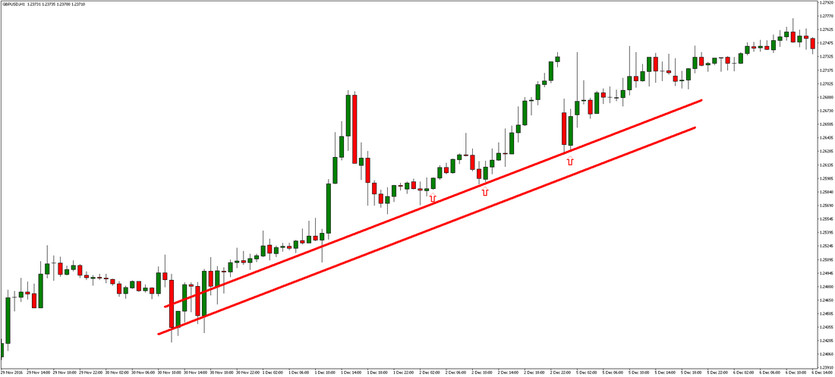
In the chart below, you can see that there was the well-established bullish trend (highlighted by the red rising channel). The channel here acted like a rising S/R zone.

As you can see in the chart above, all Inside Bars bouncing near the red rising channel were profitable - considering that we are taking the bullish breakouts here only.
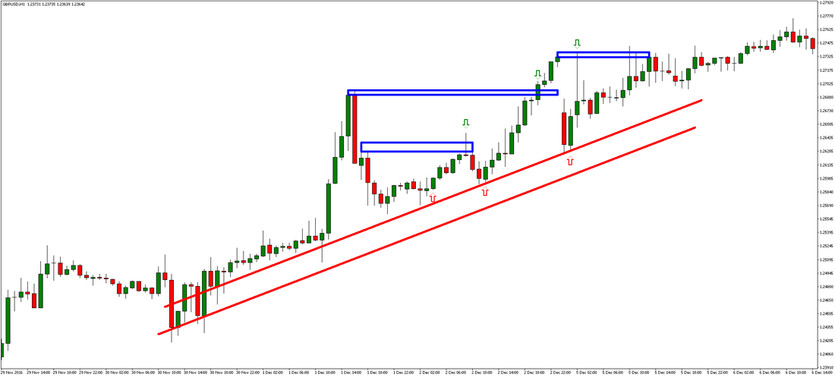
Okay, so now you already know that in case of the Inside Bars above, you would place buy stop orders above their high, and Stop-Loss orders below Inside Bars low or below the rising S/R zone. But where to take profits? As you already maybe know from our previous articles, the market itself tells you everything you need to know - especially how much profits it will offer to you. Below you can see where exactly profits would be taken based on using the support and resistance zones.

Conclusion
Now it is your turn - open your charts, analyze Inside Bars, supports and resistances, the main trend of a market, and explore how you can make some nice profits by trading the Inside Bar pattern.


