If you have been using a lot of indicators in trading, you have probably heard of the MFI.
MFI stands for Money Flow Index, and it basically functions as a momentum indicator.
The Money Flow Index calculates the outflow and inflow of money that enters in the market within a specific period of time.
To calculate the outflow/inflow of money and the trading pressure, the Money Flow Index is using the volume and the price of a market. Since this momentum indicator is adding up the trading volume to the RSI ( Relative Strength Index ), it is also known as the volume-weighted RSI.
The Money Flow Index utilizes the volatility and the volume of an asset to identify the buying and selling pressure on a market. The indicator was originally created by Gene Quong and Avrum Soudack. The Money Flow Index is normalized and its values oscillate from 0 to 100.
Although there is no true volume data for the Forex market, the Money Flow Index still works well for Forex trading. Inputting volume data from your trading provider ( forex broker ) can give similar results as the volume data for the stock market even though there is no single broker that can capture the whole volume in the Forex market.
How can you use the Money Flow Index?
The Money Flow Index, like most other momentum indicators, is also widely used to evaluate oversold and overbought market conditions. MFI values of 80 and over indicate overbought conditions, meanwhile, values of 20 and below indicate oversold conditions.
When it comes to divergence trading, the Money Flow Index is also extremely valuable.
This momentum indicator shows the differences between the troughs and peaks of the Money Flow. Eventually, the price action combined with the MFI can give reliable trading signals. This indicator is easy to understand especially if you are already trading and you are familiar with other momentum oscillators.
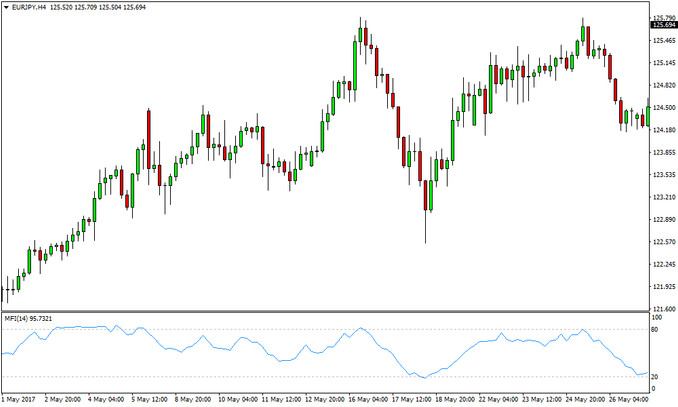
The Money Flow Index on a Euro-Yen chart
Since the MFI has many similarities with the RSI, it can be used in the same way the RSI is used. Generally, the MFI is considered to give better signals on divergences while the RSI is usually more accurate on picking overbought and oversold levels.
Using the RSI and MFI together to confirm each other is not an uncommon trading practice as well. The best way this can be done is to weigh the different signals based on the accuracy of each indicator for a specific type of signal.
So, for example, traders that use the RSI and MFI together can perhaps give more importance to an overbought RSI reading but ignore divergences on the RSI indicator, and instead, pay attention to divergences in the MFI.
According to its developers, the Money Flow Index is best to be used with a 14 days calculation period.
The calculation starts with the raw flow of money which is calculated based on the typical price and the volume for given trading period. Then, its ratio of money flow is computed with the negative and positive money flows within the provided 14 days.
Lastly, with the help of money flow’s ratio, the overall Money Flow Index is determined.