The symmetrical triangle is another technical trading pattern on the price chart of different asset classes. Traders anticipate a breakout or breakdown strategy that will continue in the direction of the first breakpoint.
The symmetrical triangle patterns are identified after the price movement has formed a series of converging lower highs and higher lows for it to be called a triangle.
The symmetrical triangles are more of a neutral chart formation because the breakout can be either to the upside or downside.
There will be a squeeze to the upside and downside, i.e., a tug of war between the buyers and sellers.
Breakout of Symmetrical Triangle - Entry and Exit Conditions (Stop Loss, Take Profit)
BULLISH TREND:
In a Bullish symmetrical triangle breakout, the prior trend is expected to be in an uptrend because the break is meant for continuation of a trend.
CONDITIONS:
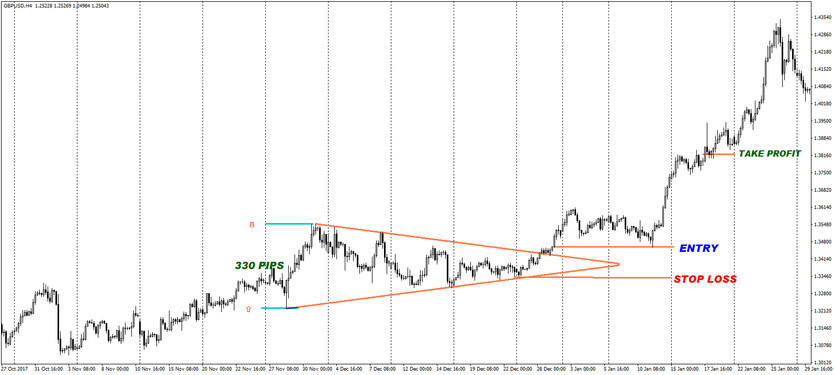
THE BULLISH SYMMETRICAL TRIANGLE PATTERN.

From the above GBPUSD H4 chart as an example;
- The symmetrical triangle height is 330 pips.
- The entry price was at the close of the candle that closed above the symmetric triangle at 1.38100.
- The stop-loss position is established at the last swing low, which is 1.33300.
- Take profit is at the 330 pips from entry position if using the height of the symmetric triangle.
- Take profit position is at 1.41400.
However, it is optional for other traders. Some will use the entry position and stop-loss position for take profit i.e. ratio 1:1 or 1:2.
Breakdown of Symmetrical Triangle - Entry and Exit Conditions (Stop Loss, Take Profit)

BEARISH TREND:
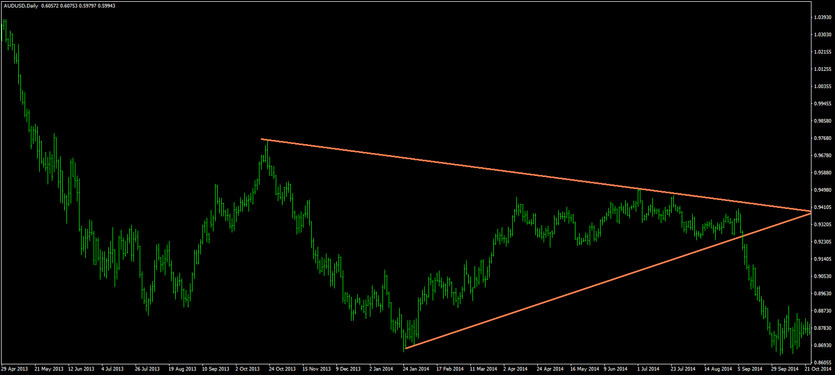
In a Bearish symmetrical triangle breakdown, the prior trend is expected to be in a downtrend because the break is meant for continuation of a trend.
CONDITIONS:
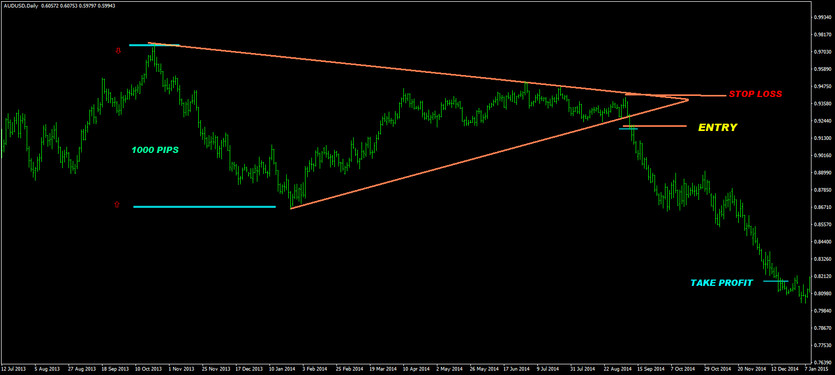
THE BEARISH SYMMETRICAL TRIANGLE PATTERN

From the above AUDUSD daily chart as an example;
- The symmetrical triangle height is 1000 pips.
- The entry price was at the close of the candle that closed below the symmetric triangle at 0.91900.
- The stop-loss position should be set at the last swing high, which is 0.94200.
- Take profit is at the 1000 pips from entry position if using the height of the symmetric triangle.
- Take profit position is at 0.81900.
However, it is optional for other traders. Some will use the entry position and stop-loss position for take-profit, i.e., ratio 1:1 or 1:2.
Conclusion
Traders should note that the symmetrical triangle pattern can fail, and some breakout or breakdown entries can be false only for the price to reverse its trend after the break.
However, it can prove to be a useful trading strategy in a traders’ tool kit when deployed in combination with other setups.


